
Fig. 4.
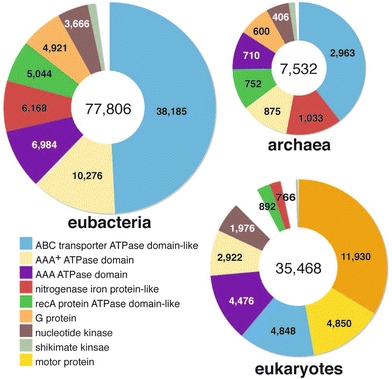
Protein family distribution of ‘P-loop containing nucleoside triphosphate hydrolases’ superfamily in each kingdom. In the three pie charts, the section with the same color is a category of the same family except for the white section
Official websites use .gov
A
.gov website belongs to an official
government organization in the United States.
Secure .gov websites use HTTPS
A lock (
) or https:// means you've safely
connected to the .gov website. Share sensitive
information only on official, secure websites.
Protein family distribution of ‘P-loop containing nucleoside triphosphate hydrolases’ superfamily in each kingdom. In the three pie charts, the section with the same color is a category of the same family except for the white section