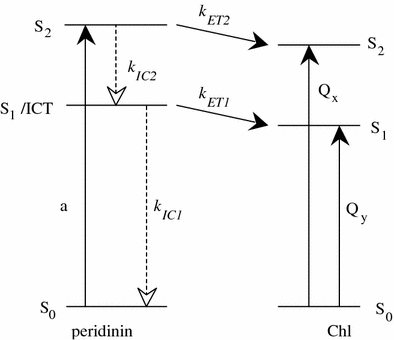
Fig. 9.

Schematic diagram of energy levels and energy transfer pathways between peridinin and Chl in the PCP complexes. kET1 and kET2 (solid lines) are rate constants for energy transfer from the S2 and S1/ICT states of peridinin to Chl. kIC2 and kIC1 (dashed lines) are rate constants for internal conversion from S2 to S1/ICT and S1/ICT to S0, respectively
