
Figure 3.
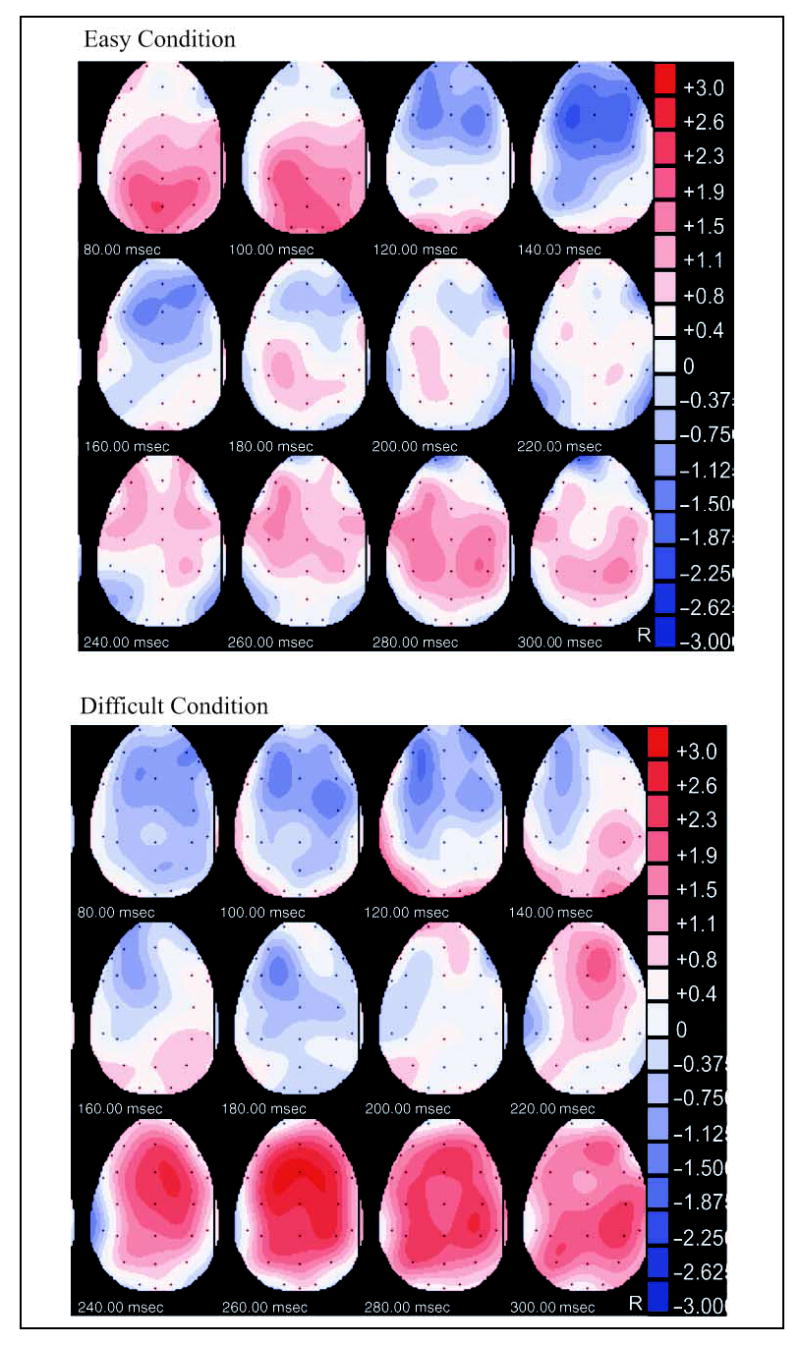
Deviant minus standard voltage distribution over the scalp during the N1, MMN, and P3a time windows, in the easy (top) and difficult (bottom) task conditions. R = right.
Official websites use .gov
A
.gov website belongs to an official
government organization in the United States.
Secure .gov websites use HTTPS
A lock (
) or https:// means you've safely
connected to the .gov website. Share sensitive
information only on official, secure websites.
Deviant minus standard voltage distribution over the scalp during the N1, MMN, and P3a time windows, in the easy (top) and difficult (bottom) task conditions. R = right.