
Figure 4A.
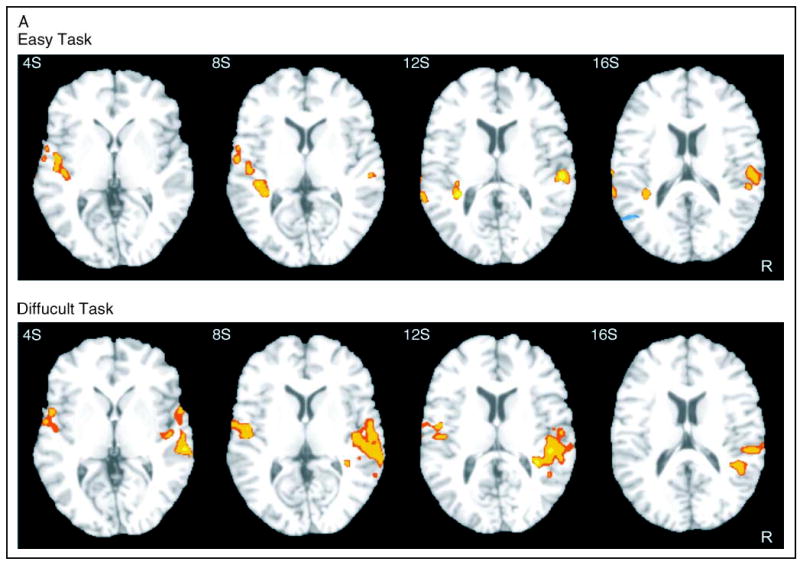
Statistical parametric maps of activation ( p < .05, corrected) in the contrast D–S, in the easy (top) and difficult (bottom) condition. R = right. Slice position appears in the upper left corner (S = superior).
Official websites use .gov
A
.gov website belongs to an official
government organization in the United States.
Secure .gov websites use HTTPS
A lock (
) or https:// means you've safely
connected to the .gov website. Share sensitive
information only on official, secure websites.
Statistical parametric maps of activation ( p < .05, corrected) in the contrast D–S, in the easy (top) and difficult (bottom) condition. R = right. Slice position appears in the upper left corner (S = superior).