
Figure 2.
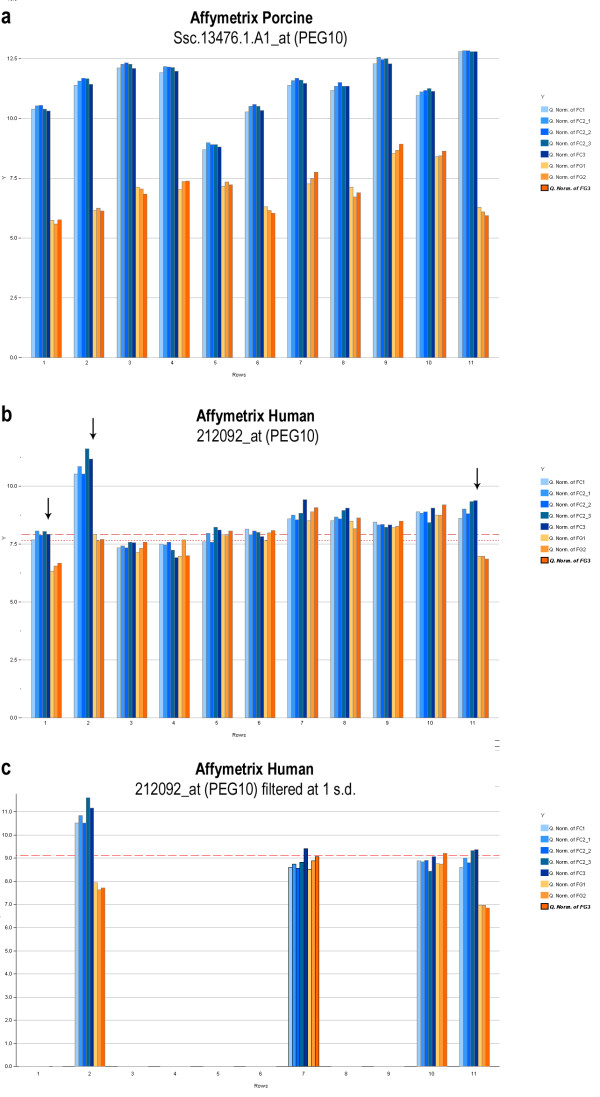
Effects of probe set filtering. (a) A well behaved probe set on the Affymetrix Porcine platform. Differential expression is evident across the entire probe set. (b) A typical probe set on the Affymetrix Human platform. Differential expression (black arrows) is evident in only on three of eleven probes. (c) Probe set filtering performed at a stringent threshold of one standard deviation above the mean array intensity (red dotted line). Note that while two of the probe sets exhibiting differential expression are captured, one is lost, and two probe sets which do not indicate differential expression also remain.