
Figure 3.
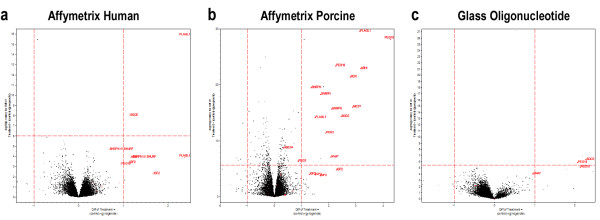
Volcano plots of differential expression. Volcano plots of estimate of differential expression for (a) Affymetrix Human, (b) Affymetrix Porcine, and (c) glass spotted long oligonucleotide microarray. These plots provide an immediate visual assessment of the degree of detectable differential gene expression as well as concordance with predicted differential gene expression.