
Figure 4.
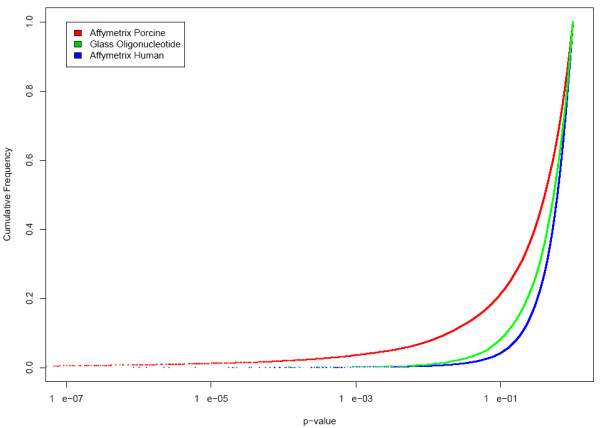
Cumulative distribution frequency of p-values. Cumulative distribution frequency of p-values for the three array platforms. This plot shows that at all p-values the highest number of differentially expressed genes is identified by the Affymetrix Porcine platform.