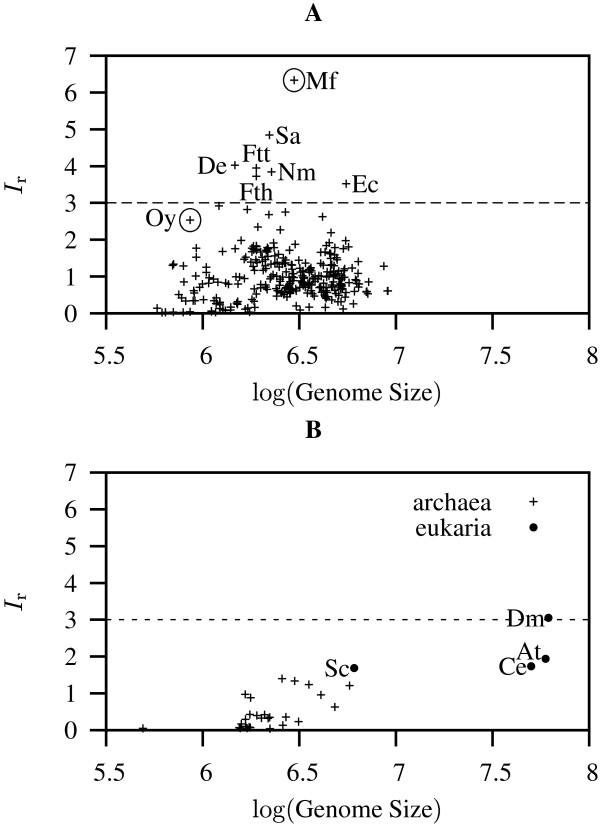
Figure 2.
Ir values of 334 completely sequenced genomes taken from the three domains of life. Ir values shown as a function of their log genome size; dashed lines delineate organisms with Ir > 3. A: Eubacteria, circled values correspond to the genomes subjected to sliding window analysis in Figure 3; Mf: Methylobacillus flagellatus KT; Sa: Streptococcus agalactiae NEM316; De: Dehalococcoides ethenogenes 195; Ftt: Francisella tularensis subsp. tularensis SCHU S4; Nm: Neisseria meningitidis MC58; Fth: Francisella tularensis subsp. holarctica; Ec: Escherichia coli O157:H7 EDL933; Oy: Onion yellows phytoplasma OY-M. B: archaebacteria and eukaryotes; Sc: Saccaromyces cerevisiae; Ce: Caenorhabditis elegans; At: Arabidopsis thaliana; Dm: Drosophila melanogaster.

