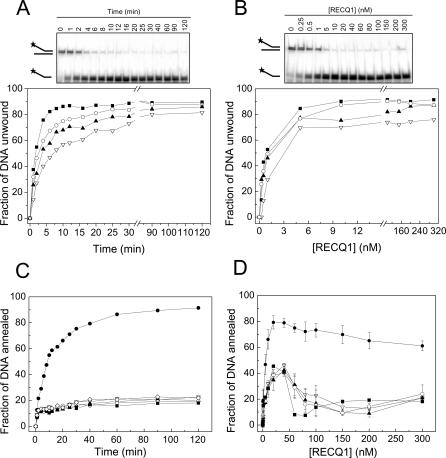
Figure 1. Analysis of the Unwinding and Strand Annealing Activities of RECQ1.
(A) Kinetics of unwinding performed using 5 nM RECQ1.
(B) RECQ1 unwinding at varying enzyme concentrations (15-min reaction).
(C) Kinetics of strand annealing in the presence of 20 nM RECQ1 and in the absence of enzyme (open diamond [◊]).
(D) Analysis of RECQ1 strand annealing activity as a function of protein concentration (15-min reaction). Data points were the mean of three independent experiments with the standard deviation indicated by error bars. The concentration of ATP in all the experiments varied from 0 to 5 mM (filled circle [•] = 0 mM, open inverted triangle [▿] = 0.5 mM, filled triangle [▴] = 1 mM, open circle [○] = 2 mM, and filled square [▪] = 5 mM).

