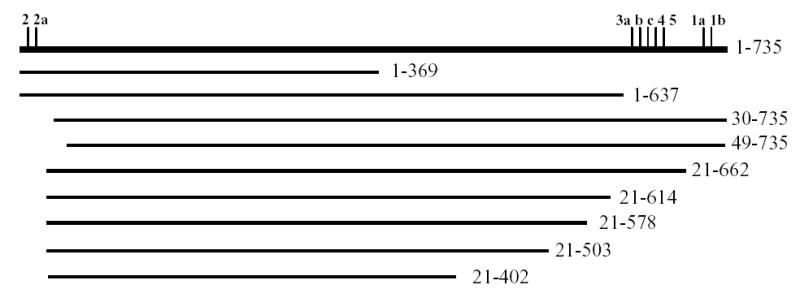
Figure 2. Schematic representation of wild type and truncated glycogen synthase.

Glycogen synthase protein is shown as horizontal line; the vertical tick marks indicate phosphorylation sites. The numbers to the left indicate the first and the last amino acids in the protein sequence of wild type (1–735) and truncated glycogen synthase.
