
Figure 5.
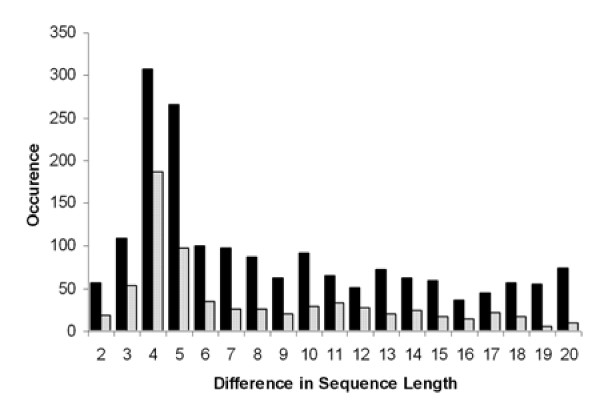
Histograms displaying the occurrence of the alternate donor class by differences in sequence length between the two alternatively spliced donor sites. The histogram shows the bins for the range from 2 bp to 20 bp for rice (black bar) and Arabidopsis (stippled bar).