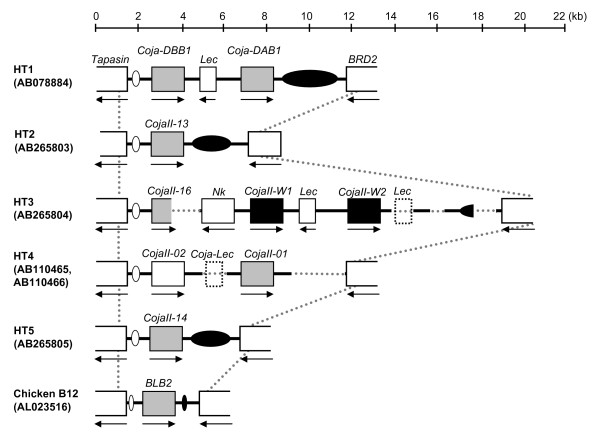
Figure 3.

Genomic structures of the major transcribed MhcIIB segments in the quail and chicken. The map shows the comparison of the major transcribed MhcIIB segments on five Coja haplotypic sequences (HT1 HT2 HT3 HT4 and HT5) and the chicken B12 haplotype sequence. Gray striped and black boxes indicate the major transcribed MhcIIB moderately transcribed MhcIIB and non-transcribed MhcIIB respectively. White boxes indicate other genes. The numbers in parenthesis are the GenBank accession numbers. The white oval indicates TB1 and the black oval indicates the location of TB2-1 TB2-2 and TB3.
