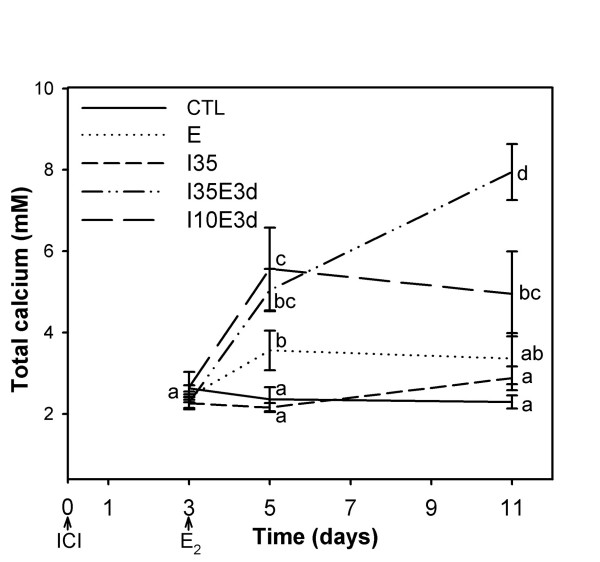
Figure 1.
Time-course of total calcium plasma response in tilapia. Adult male tilapia received coconut oil implants with different combinations of estradiol (E2) and of the antiestrogen ICI 182,780 (ICI). Times of injection are represented by arrows on the lower panel. CTL = control group, coconut oil only; E = 10 mg/kg body weight E2; I35 = 35 mg/kg ICI; I35E3d and I10E3d = 10 mg/kg E2 injected three days after injection with 35 or 10 mg/kg ICI, respectively. Blood samples were collected 3, 5 and 11 days after the first injection. Different letters indicate statistically significant differences (P < 0.05) among treatments and sampling times, evaluated by two-way repeated-measures ANOVA using log10 of calcium plasma levels.

