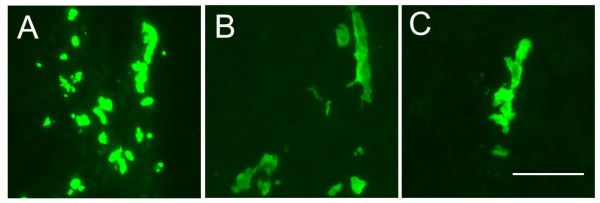
Figure 3.

The morphology of brain EC in neurospheres after 5 days. Mouse brain EC were prepared, labelled with cell tracker, and plated onto mouse neurospheres, as described in Methods. 5 days later, brain EC morphology was analysed in frozen sections under fluorescent microscopy. A-C are representative examples of the morphologies observed. Scale bar = 50 μm. Note that after 5 days co-culture, some brain EC form linear structures within neurospheres, reminiscent of the early vascular structures observed in the developing CNS.
