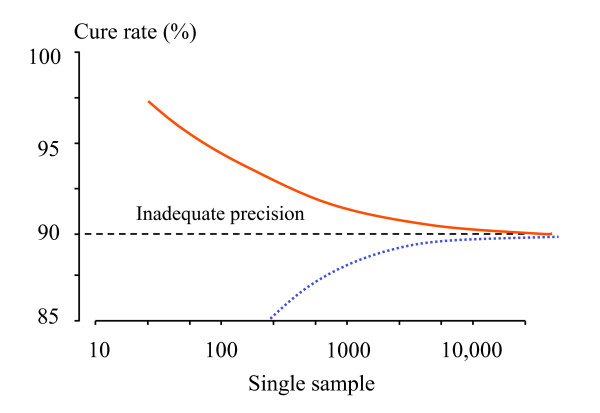
Figure 6.
The relationship between sample size (in a single sample) and precision in characterizing the cure rate is shown; the upper solid line shows the boundary for the cure rate below which the lower 95% confidence interval bound for the proportion falls below 90%, and the lower dotted line shows the boundary for the cure rate below which the upper 95% confidence interval bound for the proportion exceeds 90%. Sample sizes to the left of the curves provide inadequate precision if the objective is to be sure the confidence interval for the sample does not cross 90%.

