
Fig. 2.
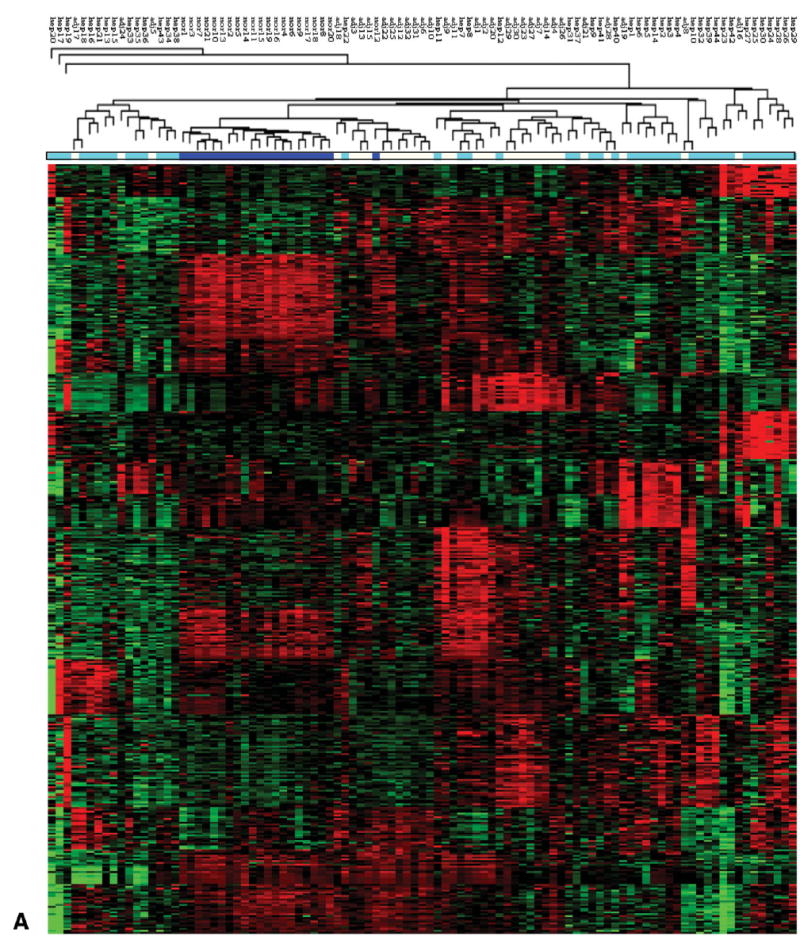

Sub classification of HCC using gene expression clustering. (A) Heat map of hierarchical clustering of all tissue samples (NL, AT, HCC and HPBL) using 419 tight clustered genes, derived by algorithms specified in Materials and Methods. The color bar under the hierarchical tree shows the sample information. Dark blue: normal samples. Light blue: tumor samples. White: tumor-adjacent samples. (B) Heat map of hierarchical clustering of all tumor samples (HCC and HPBL) using 419 tight clustered genes. Hepatoblastomas cluster between the two yellow lines. (C) Heat map of hierarchical clustering of tumor samples excluding 7 HPBL samples from children. HCC cases positive for hepatitis C are marked with red arrowheads. The two cases of fibrolamellar carcinomas are marked with black arrowheads.