
Fig. 3.
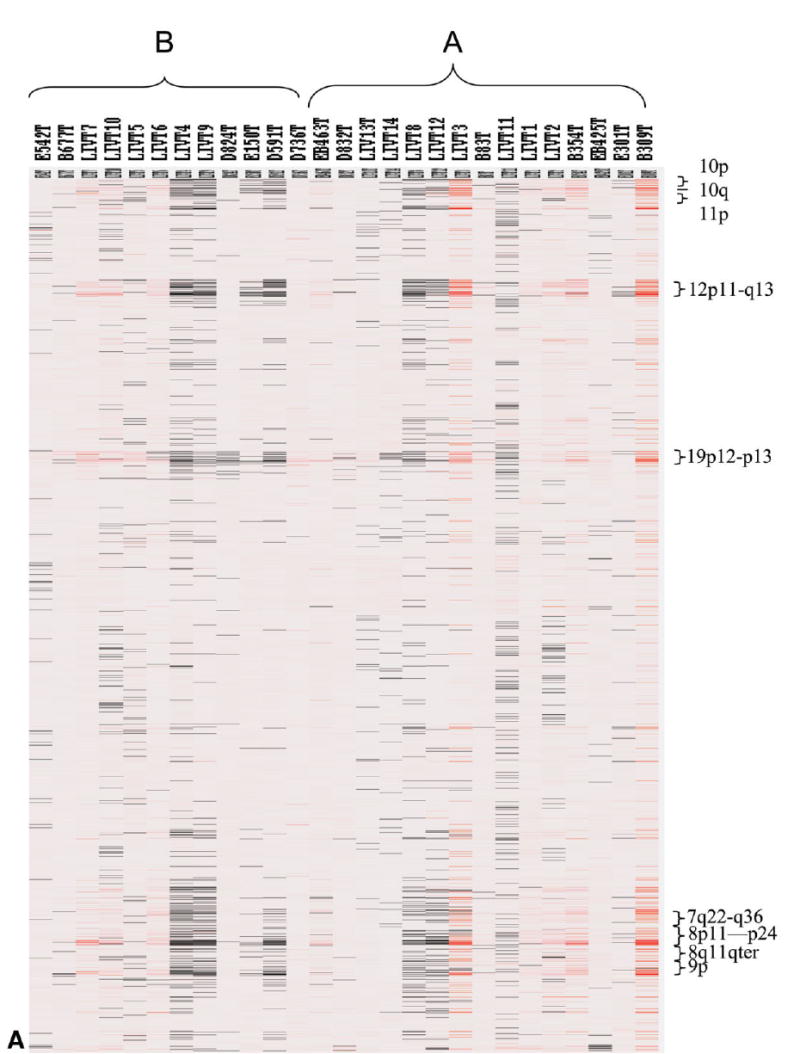

Genomic alterations in HCC. (A) Heat map display of genome copy alteration in HCC samples belonging to Clusters A and B. Red color indicates increase in gene copies, black indicates decreased copies and white indicates no changes. The chromosome areas with marked changes are shown on the right y-axis. Several loci show alterations in copy numbers (increase or decrease) across all HCC. (B) Genome-wide concordance analysis of gene copy number and expression changes. Average copy number of each locus in HCC genome (blue) was plotted along with the physical location in each of the chromosomes. The corresponding average mRNA levels of each of the genes in the HCC samples (red) were expressed as a ratio with that of NL samples and plotted as log2 in the graph. GPC3 and TIEG are indicated by arrows. (C) Concordance analysis GPC3 gene copy and mRNA expression in the 27 HCC samples. Red: Ratio of gene expression for HCC/NL; Blue: Gene copy number.