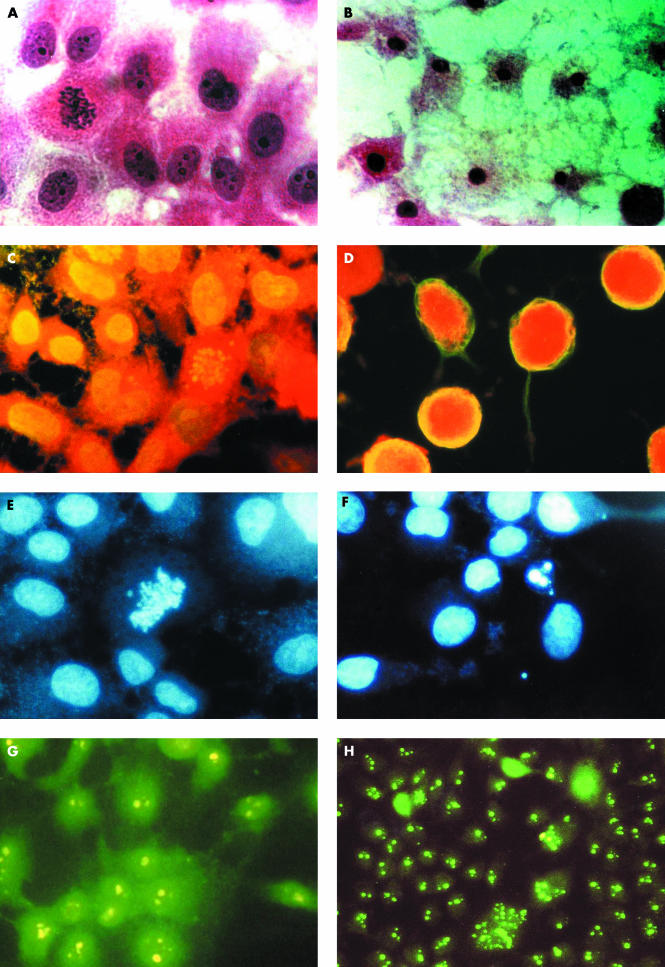
Figure 2.
Cell studies. (A) Control cells showing normal cell morphology; (B) cells treated with muti, showing necrosis; both haematoxylin and eosin stain (original magnification, ×400). (C) Control cells showing even distribution of β tubulin in the cytoplasm; (D) treated cells showing severe destruction of β tubulin with “naked nuclei”; both indirect immunofluorescence for β tubulin (original magnification, ×1000). (E) Control cells including a normal dividing cell; (F) treated cells showing apoptotic bodies; DAPI stain (original magnification, ×1000). (G) Control cells with even distribution of two or three nucleoli for each cell; (H) treated cells showing cells with multiple segregated nucleoli; indirect immunofluorescence for antinuclear antibody (original magnification, ×800).

