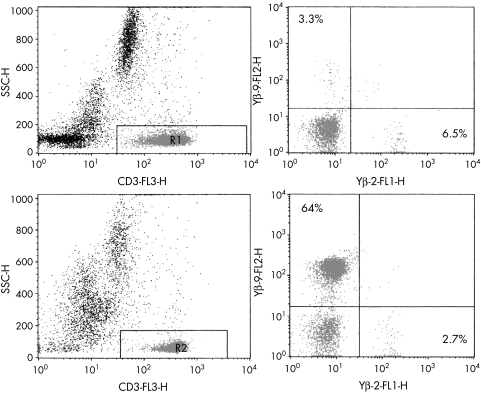
Figure 3.
Representative flow cytometric T cell receptor β variable gene (TCRVB) profiles of a healthy control compared with a patient with T cell lymphoma. TCRVβ repertoire analysis was performed using triple colour analysis with CD3 in combination with two different TCRVβ antibodies for each tube. Images on the left show CD3 versus side scatter (SSC) gating to identify the T cells. Images on the right show staining using Vβ2 and Vβ9 labelled antibodies. Only small percentages of Vβ positive T cells can be identified in the healthy control (upper panel), whereas a large T cell population expressing Vβ9 (64%) was identified in the T cell lymphoma (lower panel).

