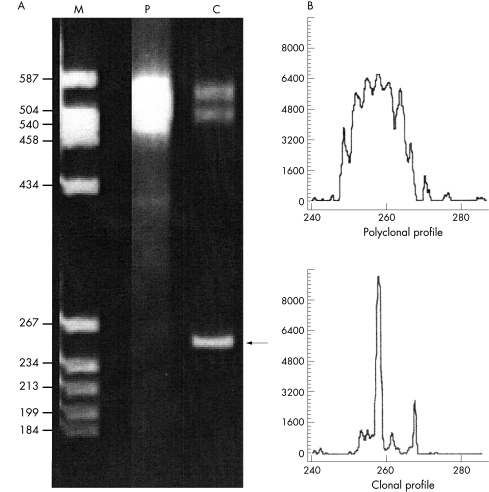
Figure 4.
Heteroduplex and fluorescent gene scanning analyses. The same T cell receptor β gene (TCRB) polymerase chain reaction (PCR) products, amplified using the BIOMED TCR VB–JB primers (JJM van Dongen et al, unpublished data) are shown by (A) heteroduplex analysis and (B) fluorescent gene scanning. (A) M, molecular weight size marker, with sizes indicated in base pairs; P, polyclonal peripheral blood control; C, clonal T cell lymphoma control. In the polyclonal control, only heteroduplexes are visible as a smear at ∼ 500–550 bp, which results from the re-annealing of the polyclonal PCR fragments of different sizes and sequences. The clonal homoduplex PCR product is indicated by an arrow at about ∼ 259 bp, whereas the heteroduplex PCR products in the sample run behind at about 500–550 bp. (B) Relative fluorescent intensities (ordinate) are plotted as a function of PCR fragment size (abscissa). The polyclonal control in the upper panel shows a normal Gaussian distribution of PCR products of different sizes within the appropriate size range (250–290 bp). The clonal T cell lymphoma control in the lower panel shows a dominant fluorescent peak indicative of a clonal population with identical PCR fragment sizes at ∼ 259 bp.

