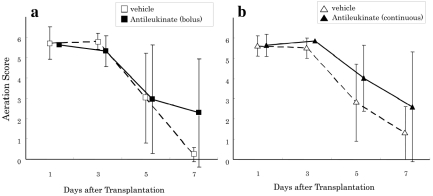
Figure 1.
Radiographic aeration score (0 = opaque to 6 = normal-appearing lung). (a) ▪ and □ demonstrate group A (antileukinate early administration) and Cont-A (vehicle), respectively. There are no significant differences at each time point. (b) ▴ and ▵ demonstrate group B (antileukinate continuous) and Cont-B (vehicle), respectively. There are no significant differences at each time point. The value was expressed as mean ± standard deviation.

