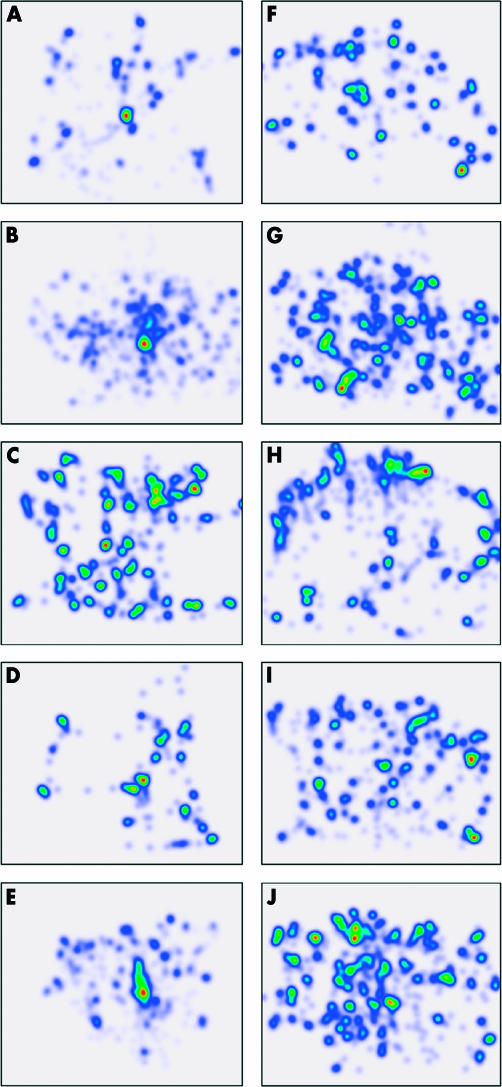
Figure 4.
The scanning patterns of pathologists 1 to 5 (top to bottom) for lesion 1 (A–E) and 2 (F–J), visualised in density cloud images. Differences in the relative amount of study time for each area are represented by different colours. The colour spectrum runs from red, yellow, green, turquoise, dark blue to light blue for high to low attention.

