Abstract
Aims: To examine pathology characteristics of breast cancers detected by mammography screening over 10 years in Scotland, and compare the nature of cancer yields after different levels of very small invasive cancer at prevalence detection.
Methods: A pathology database of cancers from mammography screening of women aged 50–64 years invited every three years was used to assess the variation over time in annual yield of different invasive cancer sizes. Screening centres were compared for incidence screen yields, according to sizes, histological type, grade, and node status.
Results: There was a significant trend over time for increased detection of < 15 mm cancers among 2353 prevalence cancers, and a significant trend for increase in all size groups, < 10, 10–14, < 15, and ≥ 15 mm, among 2245 incidence cancers. Based on individual screening centres, there was a significant negative relation between proportions of very small (< 10 mm) cancers at prevalence screens and of large (≥ 15 mm) cancers at incidence screens of the same “cohort” three years later. There was no significant relation on the same centre basis for worse pathology characteristics (histological no special type, high grade, and positive node status) in cancers detected in the same “cohort” three years later.
Conclusions: Sensitive mammography screening has a significant effect on the nature of yields at subsequent screens. Length of screening interval and consistency in pathologist opinions are factors that account for lack of effect on incidence cancer qualitative pathology characteristics. These issues are relevant to the use of such characteristics as surrogate measures of service screening performance.
Keywords: breast cancer screening, pathology, mammography, surrogate measure, sensitivity
It is accepted that the aggressive nature of breast cancer can be assessed from qualitative pathology characteristics, specifically the histological type, grade, and node status for metastasis. On this basis, cancer characteristics in screening trial subpopulations of the Swedish two counties trial have been used to investigate the potential for cancer to progress in aggressiveness with time (phenotypic drift), or to vary in the duration of possible screen detection ahead of clinical presentation (mean sojourn time).1 Such information is of key importance when interpreting screening effects. Indeed, some UK regions have reported the qualitative pathology characteristics of cancers in subpopulations of invited women, but have focused on the nature of interval cancers.2,3 However, in terms of a national, or UK regional, multicentre service, screening activity access to such complete population information is not standard, with detailed information gathered only from screen detected cancers. Therefore, we have examined the pathology database of the Scottish breast screening programme (SBSP) for a period of 10 years from April 1991, after the whole population in the 50–64 year age group was included and the means of central pathology data collection and storage was robust. The major question posed was whether or not the sensitivity of mammography screening, measured by the frequency of invasive cancers detected at size less than 10 mm, influenced the nature of the cancer yield at subsequent screens. Based on the concept of phenotypic drift and variable mean sojourn time, indirect evidence of screening benefit would derive from showing that fewer large cancers, and with less aggressive biological characteristics, were detected after more sensitive screens.
“It is accepted that the aggressive nature of breast cancer can be assessed from qualitative pathology characteristics, specifically the histological type, grade, and node status for metastasis”
METHODS
The SBSP operates through seven screening centres that invite women from the age group 50–64 for mammography screening every three years, and collects data centrally for each woman’s screening episode. Forms to record core data sets, agreed by UK quality assurance groups, are completed by health professionals and the details are entered in the SBSP computer call/recall system. Pathology information for cancers conforms with the data identified in the UK guidelines,4,5 which include directions to promote consistency in cancer sizing, histological typing, and the Nottingham system of grading. Responsibility for completion of data forms for each cancer resides with a designated pathologist at each of the seven Scottish centres, at which 26 pathologists were accredited for reporting screen detected cancers. The system incorporates validation at the point of data entry to assist screening centres in achieving a high standard of data collection.6
Our analysis is restricted to the period April 1991 to March 2001, and we have only included data separated into prevalent and incident round for the age group 50–64 years. Prevalent round data include results from women attending their first invitation to breast screening or those attending having failed to attend previous invitations. Incident round data include results from women who previously attended within the past five years. The women attending the screening centres at different times have been described here as a “cohort”; strictly they form an approximate cohort because some women will move to other areas.
Scottish invasive cancer detection rates for each 1000 women screened were analysed over the following size groupings; less than 10 mm, 10 to 14 mm, less than 15 mm, and greater than or equal to 15 mm. Poisson regression was used to analyse trends in the data over the period 1991/2 to 2000/1.
Invasive cancer size was used to measure the “screening sensitivity” of different centres. The number of prevalent very small (< 10 mm) invasive cancers was expressed as a proportion of all sized invasive cancers for the seven Scottish screening centres on an annual basis. The proportion of all sized cancers was used here in preference to the rate for each woman screened. This avoids the potential of a dilution effect on detection rates (for a given feature—for example, ≥ 15 mm) because centres that perform well at the initial prevalent screen are expected to continue to perform well. For the example given, higher detection rates of cancers less than 15 mm at incident screens at these centres would dilute any effect on detection rates of cancers ≥ 15 mm in these “good” centres. The relations between this screening sensitivity and the proportion of cancers with particular pathology characteristics at incidence screens at the same centre were then examined as specified in the Results section.
Pearson’s correlation coefficient was used to look at the relation between screening sensitivity and the opposing measures, with the exception of the interval cancer data, where Spearman’s rank order correlation coefficient was used.
Statistical software packages STATA and SPSS were used.
RESULTS
Although the database did not acquire general and pathology information from the first two active centres (SE Scotland/Edinburgh and one Glasgow centre) for the years 1988 to 1991, the system was robust for all centres from April 1991. Table 1 shows the yield of cancers entered into the pathology database file for the fiscal years 1991/2 to 2000/1, separately for prevalence and incidence screens, as totals for (1) invasive size groups, (2) combined histology grade, and (3) node metastasis status. Decreased numbers for prevalence screens across Scotland from 1994 to 1995 signify the screens were essentially of women aged 50–53 years, whereas the much higher numbers for incidence screens from that year signify they were of women aged 54–64 years. However, because of the phased introduction of screening in different geographical regions, the age ranges at prevalence and incidence screens were not equivalent at each centre. Note also, the very low numbers of cases with missing data on pathology characteristics for the screens for the last five years of prevalence and incidence screens.
Table 1.
Yield of cancers entered into the pathology database for 1991/2 to 2000/1
| 1991/2 | 1992/3 | 1993/4 | 1994/5 | 1995/6 | 1996/7 | 1997/8 | 1998/9 | 1999/00 | 2000/1 | Overall % missing | 2000/1 % missing | |
| Prevalent round | ||||||||||||
| Women screened | 87068 | 92606 | 64287 | 39014 | 30528 | 30245 | 32385 | 31321 | 32530 | 33613 | ||
| Cancers detected | 485 | 546 | 437 | 186 | 248 | 205 | 187 | 217 | 248 | 239 | ||
| Invasive cancers detected | 402 | 443 | 348 | 146 | 187 | 156 | 149 | 158 | 180 | 184 | ||
| Invasive cancers <10 mm | 85 | 100 | 101 | 33 | 49 | 36 | 42 | 39 | 39 | 39 | ||
| Invasive cancers <15 mm | 172 | 210 | 181 | 66 | 99 | 84 | 84 | 82 | 94 | 84 | ||
| Invasive cancers ≥15 mm | 213 | 205 | 134 | 77 | 83 | 70 | 63 | 71 | 83 | 96 | ||
| Invasive cancers size unknown/missing | 17 | 28 | 33 | 3 | 5 | 2 | 2 | 5 | 3 | 4 | 4.3 | 2.2 |
| Invasive cancers grades 1 and 2 | 274 | 284 | 213 | 106 | 135 | 123 | 119 | 124 | 153 | 142 | ||
| Invasive cancers grade 3 | 58 | 61 | 40 | 15 | 30 | 28 | 22 | 25 | 23 | 40 | ||
| Invasive cancers not assessable/unknown/missing | 70 | 98 | 95 | 25 | 22 | 5 | 8 | 9 | 4 | 2 | 14.4 | 1.1 |
| Node negative invasive cancers | 222 | 267 | 196 | 88 | 136 | 112 | 117 | 104 | 134 | 122 | ||
| Node positive invasive cancers | 108 | 89 | 64 | 44 | 38 | 41 | 30 | 39 | 41 | 54 | ||
| Nodal status unknown/missing | 72 | 87 | 88 | 14 | 13 | 3 | 2 | 15 | 5 | 8 | 13.0 | 4.3 |
| Incident round | ||||||||||||
| Women screened | 64 | 8051 | 36133 | 56617 | 62524 | 64170 | 67127 | 66951 | 70681 | 82016 | ||
| Cancers detected | 0 | 26 | 136 | 309 | 303 | 344 | 334 | 381 | 445 | 525 | ||
| Invasive cancers detected | 0 | 22 | 112 | 253 | 228 | 276 | 278 | 309 | 357 | 410 | ||
| Invasive cancers <10 mm | 0 | 1 | 38 | 57 | 62 | 77 | 65 | 86 | 100 | 109 | ||
| Invasive cancers <15 mm | 0 | 8 | 69 | 132 | 123 | 160 | 144 | 166 | 192 | 234 | ||
| Invasive cancers ≥15 mm | 0 | 14 | 42 | 116 | 98 | 114 | 131 | 139 | 160 | 168 | ||
| Invasive cancers size unknown/ missing | 0 | 0 | 1 | 5 | 7 | 2 | 3 | 4 | 5 | 8 | 1.6 | 2.0 |
| Invasive cancers grades 1 and 2 | 0 | 16 | 72 | 178 | 170 | 198 | 213 | 238 | 266 | 282 | ||
| Invasive cancers grade 3 | 0 | 5 | 24 | 37 | 35 | 67 | 55 | 63 | 84 | 118 | ||
| Invasive cancers not assessable/unknown/missing | 0 | 1 | 16 | 38 | 23 | 11 | 10 | 8 | 7 | 10 | 5.5 | 2.4 |
| Node negative invasive cancers | 0 | 12 | 82 | 180 | 163 | 190 | 202 | 228 | 254 | 294 | ||
| Node positive invasive cancers | 0 | 6 | 20 | 59 | 53 | 72 | 66 | 73 | 87 | 101 | ||
| Nodal status unknown/missing | 0 | 4 | 10 | 14 | 12 | 14 | 10 | 8 | 16 | 15 | 4.6 | 3.7 |
Prevalent round: women attending their first invitation or those attending an appointment having previously failed to attend (ages 50–64 years). Incident round: women attending subsequent invitations having previously attended a screening appointment within the past 5 years (ages 50–64 years).
Cancer yields by size
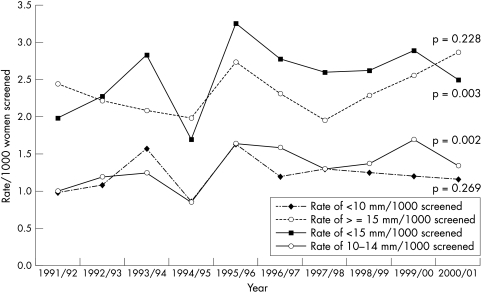
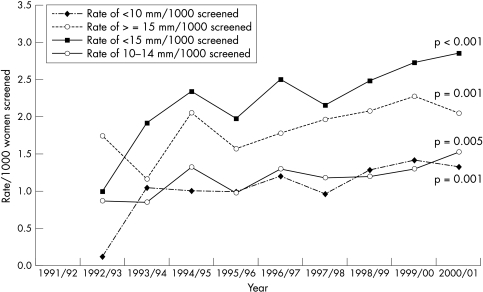
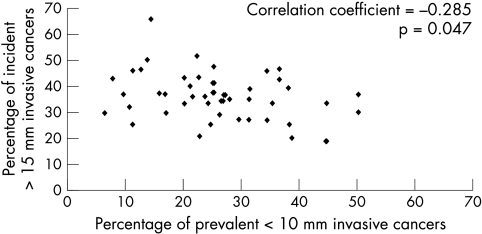
The rates for cancer detection of very small (< 10 mm), small (< 15 mm), and large (≥ 15 mm) sizes over the period of study are shown for prevalence (fig 1) and incidence (fig 2) screens in Scotland. At prevalence screens, there is no significant change in the rates for size groupings < 10 mm and ≥ 15 mm, but there is a significant trend for increased detection of < 15 and 10–14 mm. At incidence screens, all size groupings of invasive cancers show a significantly increased detection frequency over time. Figure 3 shows the relation between yields of very small cancer at one screening period with those of large size characteristics at the subsequent screening period three years later. For each of seven screening centres, the proportion of very small (< 10 mm) cancers in the annual yield for prevalence screens (1991/2 to 1997/8) is plotted against the proportion of large (≥ 15 mm) cancers in the annual yield at incidence screens three years later (1994/5 to 2000/1). There is a significant negative correlation between these values (r = −0.285; p = 0.047). The corresponding plot for prevalent small (< 15 mm) versus incident large (≥ 15 mm) cancers has a non-significant correlation (r = −0.218; p = 0.132).
Figure 1.
Invasive cancer detection rates, by size, prevalent round, 1991/2 to 2000/1.
Figure 2.
Invasive cancer detection rates, by size, incident round, 1991/2 to 2000/1.
Figure 3.
Screening centre single year data, comparing percentage of prevalent < 10 mm invasive cancers against percentage of incident > 15 mm invasive cancers, three years later. Prevalent, 1991/2 to 1997/8; incident, 1994/5 to 2000/1.
Relation of detection size to qualitative pathology features
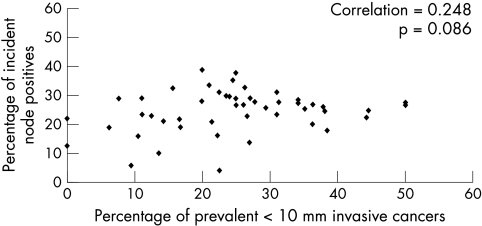
To test the influence of sensitivity for very small cancer detection on qualitative pathology features of subsequent cancer yields, the characteristics of histological type, grade, and node status were assessed on a centre basis. The relation between prevalence screening sensitivity and qualitative cancer characteristics of subsequent incidence screen yields was explored in three ways; namely, for proportionality of: (1) not special type, (2) grade III, and (3) node positivity, as exemplars of greater cancer aggression. For each cancer feature, the proportion at incidence screens for the years 1994/5 to 2000/1 was plotted, as before, against the proportion of very small cancer detection for prevalence screen at the same centre each year (three previous) for 1991/2 to 1997/8. The example for proportion node positive is shown in fig 4. In this (and each other) instance, there is no significant positive or negative correlation (other data not shown). Similarly, there is no positive or negative correlation for these features with prevalence small (< 15 mm) cancer proportions (data not shown).
Figure 4.
Screening centre single year data, comparing percentage of prevalent < 10 mm invasive cancers against percentage of incident node positive cancers, three years later. Prevalent, 1991/2 to 1997/8; incident, 1994/5 to 2000/1.
Relation of cancer size to interval cancer rates
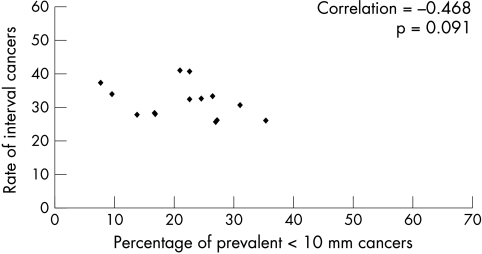
Information on interval cancers is not collected as part of the remit of the SBSP. However, data for the number of interval cancers for the period 1991–6 were available from a previous study.7 Figure 5 shows the relation between the proportion of prevalent < 10 mm cancers at each centre for the two annual periods from 1991 to 1993, against the cumulative interval cancer rate for the following three year periods at that centre. The correlation is negative but non-significant (r = −0.468; p = 0.091).
Figure 5.
Screening centre single year data, comparing percentage of prevalent < 10 mm invasive cancers 1991/2 to 1992/3, against interval cancer rates for each 10 000 women screened.
DISCUSSION
This evaluation has demonstrated the varied nature of breast screening yield over both time and geographical region of Scotland from April 1991 to March 2001. In addition, with regard to cancer size, the sensitivity for very small cancer detection shows a significant negative correlation with the yield of large cancers at the next incident round at the same centre. This is in keeping with current views on the nature of cancer growth and progression, and is indirect evidence of benefit for maximally sensitive screening of well women not previously reported. A negative correlation for interval cancer frequency with increased sensitivity is also evident, but is not significant, and the lack of further more recent validated data is regretted. However, no significant relation is evident for qualitative pathology characteristics of the cancer yield with screening sensitivity measured by very small invasive cancer detection. The last finding is contrary to the original concept that cancer progression is reflected in the status for histological special type, grade, and node metastasis, and confounding factors should be considered. This is examined from three perspectives, namely, the controversy over progressive cancer biology, the duration of screening interval, and finally, the variability of professional opinions.
In the context of interaction between time and innate cancer biology, opinion remains divided. For some, the evidence in screening for phenotypic drift is compelling,1,8 whereas for others it is absent,9,10 and there is also a lack of supporting evidence from molecular biology.11,12 We have published evidence in agreement with phenotypic drift from cross sectional studies,13 and from the unbiased population of the Edinburgh trial.14 Supportive evidence for progression of grade with time comes from the trend in distribution of grade with increasing size.15 Yet, cytogenetic studies emphasise that there is more than one pathway for the progression of breast cancer.16 A recent appraisal of the progressive characteristics of breast cancer acknowledges the complexity of the issue, and concludes that at least a proportion of low grade invasive cancers progress to higher grade over time.17 We concur with this view and, although controversy remains, we look for other explanations for the failure to detect qualitative pathology differences.
“The sensitivity for very small cancer detection shows a significant negative correlation with the yield of large cancers at the next incident round at the same centre”
From the consideration of cancer screening theory, the nature of the cancer yield will be influenced by the point when diagnosis takes place in the detectable preclinical phase (DPCP).18 It follows that a greater yield from the earlier DPCP will lower the proportion of cases for detection in later stages of the DPCP at subsequent screens of that population. In terms of changing cancer characteristics through the DPCP, size is accepted to have major time dependence, whereas it is less clear10,13,19 whether the features of histological type and grade, in addition to node status, are determined by elapsed time and/or intrinsic biology. It follows in this model that the time elapsed between screens will affect the nature of the “crop” of cancers potentially detectable by screening. The longer the period between screens the more likely it is for yields to be similar and reflect the prevalence status. The interval between screens adopted in the UK was three years, which is the longest of 22 countries,20 and this factor probably contributes to the lack of a relation with qualitative features found here. There is also the loss to detection of those cancers presenting as interval cases between screens. UK reports have shown that a greater proportion of those will be of higher grade,2,3 and it is to be anticipated that this effect would be accentuated where sensitivity is lower. Hence, a further confounding influence in the comparison of cancer qualitative characteristics of screen detected cases is apparent.
Although there are many different biases and confounding factors to consider when assessing breast cancer screening findings,21 variation in professional opinion is not usually considered among them. In trials, there is specialist commitment and the contribution of restricted personnel, but the issue becomes important in comparisons of service screen activity. For radiology, the significant trend for increasing cancer yields over time in Scotland recorded here reflects the improvements in mammography through the 1990s, already reported for the UK,22 as a consequence of the standardised number of views (from 1995), the optimised film density, and a broader skill base. Consistency among UK pathologists, which include all accredited pathologists in Scotland, evaluating the qualitative pathological characteristics of cancers is known to be good, but less than perfect23; indeed, consistency was best for identifying grade III cancers. Not surprisingly, the highest levels of consistency in other national surveys assessing breast cancer qualitative pathology characteristics were achieved with “specialist” panels.24 This feature has particular relevance to any study with multiple contributing pathologists, and has implications for the unqualified use of pathology qualitative characteristics as surrogate measures of screening performance.15,25 Therefore, without evidence of substantial consistency among the participating pathologists, this variable must also be considered to be a factor accounting for the lack of qualitative difference observed here.
The use of targets to measure performance is a feature of the UK breast screening programme, with specified yields of cancers less than a given size among them.4,5 Related to this, a standardised detection ratio (SDR), based on discrimination at < 15 mm,26 has been accepted in the UK to reflect comparability with Sweden, the “gold standard” for mammography screening. It is noteworthy from our present study that the effect on incident large cancer yields was only apparent for discrimination at < 10 mm, and not at < 15 mm. Also of interest is a study from the Nottingham screening centre, which reported biological relevance of discrimination at < 10 mm.27 In a comparison of screen detected cancers and primary clinical cancers that had recurred, only those cancers < 10 mm had low enough frequencies of high grade, node positivity, and vascular invasion to suppose that preclinical detection would successfully influence the likelihood of recurrence. The combination of this observation with our current study findings, and the fact that SDRs are now being exceeded comfortably in several UK centres, suggest that the definition of UK targets for mammography sensitivity should be revisited if sensitivity is to be maximised.
The evaluation of the SBSP cancer yield over 10 years has highlighted the restricted practical use of interrogating a pathology database limited to screen detected cancers. Because this is the prevailing situation for most UK regions, questions can be raised over the cost–benefit value of maintaining such specialised databases for a service activity. Audit principles might be better served with improved standards and completeness of general data collection at cancer registries—for example. Although reasons are provided here to account for the inability to detect significant differences in the qualitative pathology of cancers, our results should stimulate similar enquiries in other regions of the UK, in addition to countries with comparable population data. This may lead to a clearer understanding of the ability of surrogate end points to interpret screening impact. Such interpretation will be improved where substantial consistency between pathologists in the assessment of qualitative characteristics can be demonstrated.
Take home messages.
Sensitive mammography screening has a significant effect on the nature of yields at subsequent screens
The length of the screening interval and levels of consistency in pathologist opinions are factors that may account for the lack of effect of sensitivity on incidence cancer qualitative pathology characteristics
These issues are relevant to the use of such characteristics as surrogate measures of service screening performance
Acknowledgments
The Scottish pathology coordination group consisted of R Adamson, T J Anderson, J Lamb, E Mallon, M McKean, J McPhie, I Miller, S Nicoll, and A Robertson (chairman). H Dobson is chairperson of the Scottish radiology coordination group. We acknowledge the contribution of all SBSP staff, in particular the centre coordinators, and J Warner, the national coordinator (to 1999). The SBSP is funded by the Scottish Executive, through the national services division of the Common Services Agency.
Abbreviations
DPCP, detectable preclinical phase
SBSP, Scottish breast screening programme
SDR, standardised detection ratio
REFERENCES
- 1.Tabar L, Fagerberg G, Chen HH, et al. Tumour development, histology and grade of breast cancers: prognosis and progression. Int J Cancer 1996;66:413–19. [DOI] [PubMed] [Google Scholar]
- 2.Cowan WK, Angus B, Gray JC, et al. A study of interval breast cancer within the NHS breast screening programme. J Clin Pathol 2000;53:140–6. [DOI] [PMC free article] [PubMed] [Google Scholar]
- 3.McCann J, Britton PD, Warren RML, et al. Radiological peer review of interval cancers in the East Anglian breast screening programme: what are we missing? J Med Screen 2001;8:77–85. [DOI] [PubMed] [Google Scholar]
- 4.Sloane J, Anderson T, Brown C, et al. Pathology reporting in breast cancer screening. Oxford: NHSBSP Publications, 1990.
- 5.Sloane J, Anderson T, Davies J, et al. Pathology reporting in breast cancer screening, 2nd edition. Sheffield: NHSBSP Publications, 1995.
- 6.Warner J, Beattie C, Sharp L, on behalf of the Scottish Breast Screening Programme Central Co-ordinating Team. Scottish breast screening programme report, 1993. Edinburgh: Scottish Office, Information Services Division, 1993.
- 7.Everington D, Gilbert FJ, Tyack C, et al. The Scottish breast screening programme’s experience of monitoring interval cancers. J Med Screen 1999;6:21–7. [DOI] [PubMed] [Google Scholar]
- 8.Tabar L, Duffy S, Vitak B, et al. The natural history of breast carcinoma—what have we learned from screening? Cancer 1999;86:449–62. [PubMed] [Google Scholar]
- 9.Hakama M, Holli K, Isola J, et al. Aggressiveness of screen-detected breast cancers. Lancet 1995;345:221–4. [DOI] [PubMed] [Google Scholar]
- 10.Johnson A, Shekhdar J. Does breast cancer grade worsen with time? Evidence from breast screening. Breast Cancer Res Treat 2001;68:261–71. [DOI] [PubMed] [Google Scholar]
- 11.Roylance R, Gorman P, Harris W, et al. Comparative genomic hybridization of breast tumors stratified by histological grade reveals new insights into the biological progression of breast cancer. Cancer Res 1999;59:1433–6. [PubMed] [Google Scholar]
- 12.Roylance R, Gorman P, Hanby A, et al. Allelic imbalance analysis of chromosome 16q shows that grade I and grade III invasive ductal breast cancers follow different genetic pathways. J Pathol 2002;196:32–6. [DOI] [PubMed] [Google Scholar]
- 13.Alexander FE, Anderson TJ, Hubbard AL. Screening status in relation to biological and chronological characteristics of breast cancer: a cross sectional survey. J Med Screen 1997;4:152–7. [DOI] [PubMed] [Google Scholar]
- 14.Anderson TJ, Alexander FE, Forrest PM. The natural history of breast carcinoma—what have we learned from screening? Cancer 2000;88:1758–9. [PubMed] [Google Scholar]
- 15.Anderson TJ, Alexander FE, Lamb J, et al. Pathology characteristics that optimize outcome prediction of a breast screening trial. Br J Cancer 2000;83:487–92. [DOI] [PMC free article] [PubMed] [Google Scholar]
- 16.Buerger H, Mommers EC, Littmann R, et al. Ductal invasive G2 and G3 carcinomas of the breast are the end stage of at least two different lines of genetic evolution. J Pathol 2001;194:165–70. [DOI] [PubMed] [Google Scholar]
- 17.Cserni G. Tumour histological grade may progress between primary and recurrent invasive mammary carcinoma. J Clin Pathol 2002;55:293–7. [DOI] [PMC free article] [PubMed] [Google Scholar]
- 18.Walter SD, Day NE. Estimation of the duration of a pre-clinical disease state using screening data. Am J Epidemiol 1983;118:865–86. [DOI] [PubMed] [Google Scholar]
- 19.Tubiana M, Koscielny S. Natural-history of human breast-cancer—recent data and clinical implications. Breast Cancer Res Treat 1991;18:125–40. [DOI] [PubMed] [Google Scholar]
- 20.Shapiro S, Coleman EA, Broeders M, et al. Breast cancer screening programmes in 22 countries: current policies, administration and guidelines. Int J Epidemiol 1998;27:735–42. [DOI] [PubMed] [Google Scholar]
- 21.Cole P, Morrison A. Basic issues in population screening for cancer. J Natl Cancer Inst 1980;64:1263–72. [PubMed] [Google Scholar]
- 22.Blanks RG, Moss SM. Breast cancer screening sensitivity in the NHSBSP: recent results and implications. Breast 1999;8:301–2. [DOI] [PubMed] [Google Scholar]
- 23.Sloane J, Ellman R, Anderson T, et al. Consistency of histopathology reporting of breast-lesions detected by screening—findings of the UK National External Quality Assessment (EQA) scheme. Eur J Cancer 1994;30A:1414–19. [DOI] [PubMed] [Google Scholar]
- 24.Anderson TJ, Sufi F, Ellis IO, et al. Implications of pathologist concordance for breast cancer assessments in mammography screening from age 40 years. Hum Pathol 2002;33:365–71. [DOI] [PubMed] [Google Scholar]
- 25.Day NE, Williams DRR, Khaw KT. Breast-cancer screening programs—the development of a monitoring and evaluation system. Br J Cancer 1989;59:954–8. [DOI] [PMC free article] [PubMed] [Google Scholar]
- 26.Blanks R, Day NE, Moss SM. Monitoring the performance of breast screening programs: use of indirect standardisation in evaluating the invasive cancer detection rate. J Med Screen 1996;3:79–81. [DOI] [PubMed] [Google Scholar]
- 27.Evans AJ, Pinder SE, Burrell HC, et al. Detecting which invasive cancers at mammographic screening saves lives? J Med Screen 2001;8:86–90. [DOI] [PubMed] [Google Scholar]


