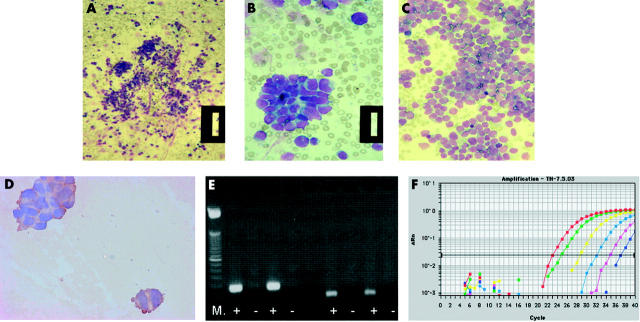
Figure 2.
Methods for the detection of micrometastases in bone marrow (BM), peripheral blood (PB), and peripheral blood stem cells from children with neuroblastoma (NBL). (A–C) Most children present with overt metastatic disease (stage 4), which can be detected by cytological assessment of BM smears for infiltrating NBL. Cytological features of infiltrating BM typically include clumps of NBL cells, readily identified from normal haemopoietic cells as blue stained round cells (A, B: patient 1; original magnification, ×16 and ×64, respectively). In some cases, the bone marrow infiltration can be so extensive that it can be difficult to identify normal BM cells (C: patient 2; original magnification, ×40). (B) Immunocytology (IC) with anti-GD2 antibodies can be used to help identify NBL cells: the cytoplasm of NBL cells is brown after staining with anti-GD2 antibodies and detection with diaminobenzidine. However, when there are less than 10 contaminating NBL cells, IC can be unreliable, unless combined with histological examination by an experienced pathologist or haematologist. (E) Reverse transcriptase polymerase chain reaction (RT-PCR) for tyrosine hydroxylase (TH) mRNA can detect down to one NBL cell in 1 × 10⁶ normal cells. After amplification for TH mRNA, PCR products are separated on an agarose gel, stained with ethidium bromide, and visualised under ultraviolet light as a bright band. Results of RT-PCR for TH mRNA (left of the gel; product size, 180 bp) and the housekeeping gene β2 microglobulin (right of gel; product size, 136 bp) in two PB samples are shown. Relevant positive and negative controls must be included in any analysis, including amplification for a housekeeping gene to confirm the quality of isolated RNA (right of gel). M, molecular weight markers; +, RT present; −, RT absent; both PB samples were positive for TH mRNA and β2 microglobulin. (F) Amplification of TH mRNA by RT real time PCR is increasingly used to identify the number of target gene transcripts in each sample; using this method it is possible to detect a single transcript of TH mRNA/cell. Amplification curves for a set of serially diluted total RNA extracted from an NBL cell line are shown: red line, 250 ng total RNA; green, 25 ng; yellow, 2.5 ng; light blue, 250 pg; pink, 25 pg; blue, 2.5 pg. Change in fluorescence value, on the y axis, is the normalised target specific fluorescence signal, plotted against the number of PCR cycles on the x axis. Each dilution is usually carried out in triplicate; only a single plot for each RNA concentration is shown for clarity.

