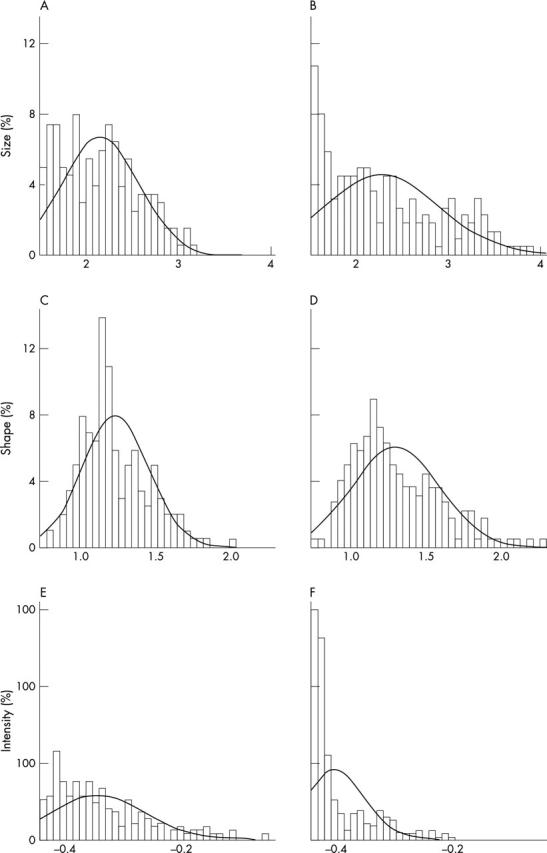
Figure 4.

Distribution of logarithmic measurements from automated quantitative image analysis of factor VIII (FVIII) stained specimens. (A) Distribution of vessel size in normal epithelium; (B) distribution of vessel size in severe dysplasia. (C) Shape distribution in normal epithelium; (D) shape distribution in moderately differentiated squamous cell carcinoma. (E) Distribution of FVIII staining intensity in normal epithelium; (F) distribution of FVIII staining intensity in less well differentiated squamous cell carcinoma.
