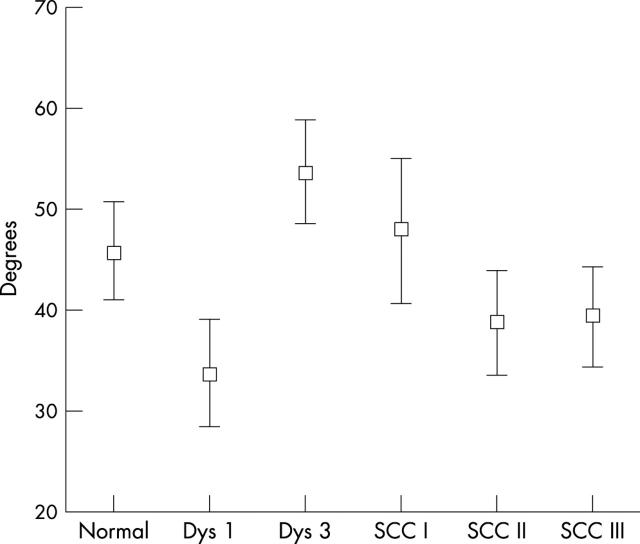
Figure 5.
Automated quantitative image analysis of factor VIII stained specimens of laryngeal lesions describing the direction of the vessel in relation to the direction of the basement membrane expressed in degrees. Results are shown as error bars, with mean and 95% confidence intervals. Dys 1, mild dysplasia; Dys 3, severe dysplasia; SCC, squamous cell carcinoma.

