
Figure 3.
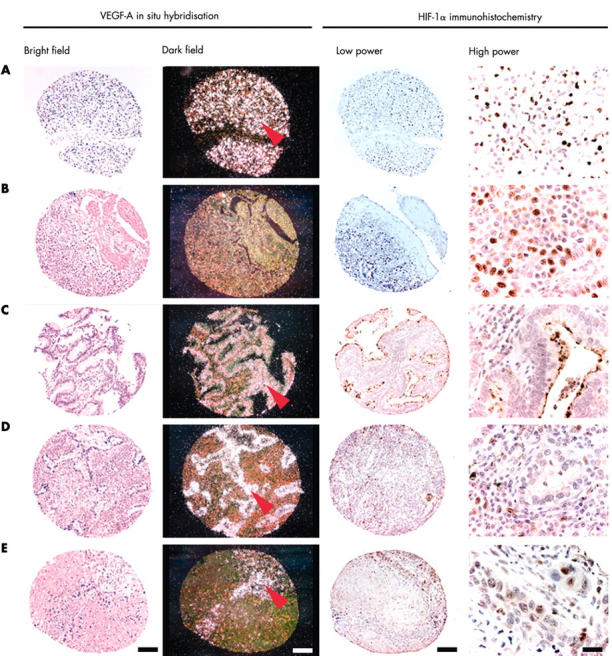
Tissue microarray cores illustrating vascular endothelial growth factor A (VEGF-A) in situ hybridisation (ISH) and hypoxia inducible factor 1α (HIF-1α) immunohistochemistry. Brightfield and darkfield images of VEGF-A ISH demonstrate silver grains overlying neoplastic cells (red arrows). (A) Renal adenocarcinoma; (B and E) lung squamous cell carcinoma; (C and D) lung adenocarcinoma. Bars: 100 μm except for high power images (20 μm). Low power and high power images of HIF-1α immunohistochemistry show nuclear localisation of the diaminobenzidine chromagen in stromal (D) and neoplastic (A, B, and E) cell populations. VEGF-A expression can be seen in both HIF-1α positive (A, B, and E) and negative (C and D) tissue cores.