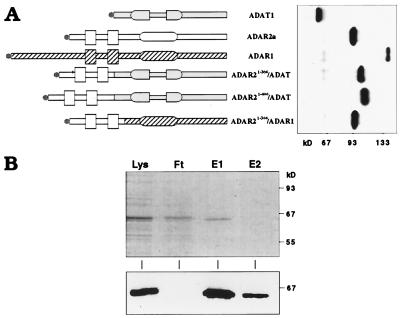
Figure 3.
Expression and purification of recombinant hADAT1. (A) Domain structures (symbols as in Fig. 1A) and Western blot analysis of native and chimeric proteins expressed in Sf9 insect cells. Gray, open or hatched areas, respectively, denote ADAT1, ADAR2a, and ADAR1 sequences. The N-terminal Flag epitope is indicated by ●, and size markers are shown on the bottom. (B) Overexpressed hADAT1 was purified by using an anti-Flag-affinity gel matrix, and aliquots from purification steps were separated on SDS/PAGE and analyzed by Coomassie staining (Upper) and Western blotting with M2 anti-Flag mAb (Lower). Lys, lysate; Ft, flowthrough; E1/E2, elution fractions 1 and 2. Size markers are shown on the right.

