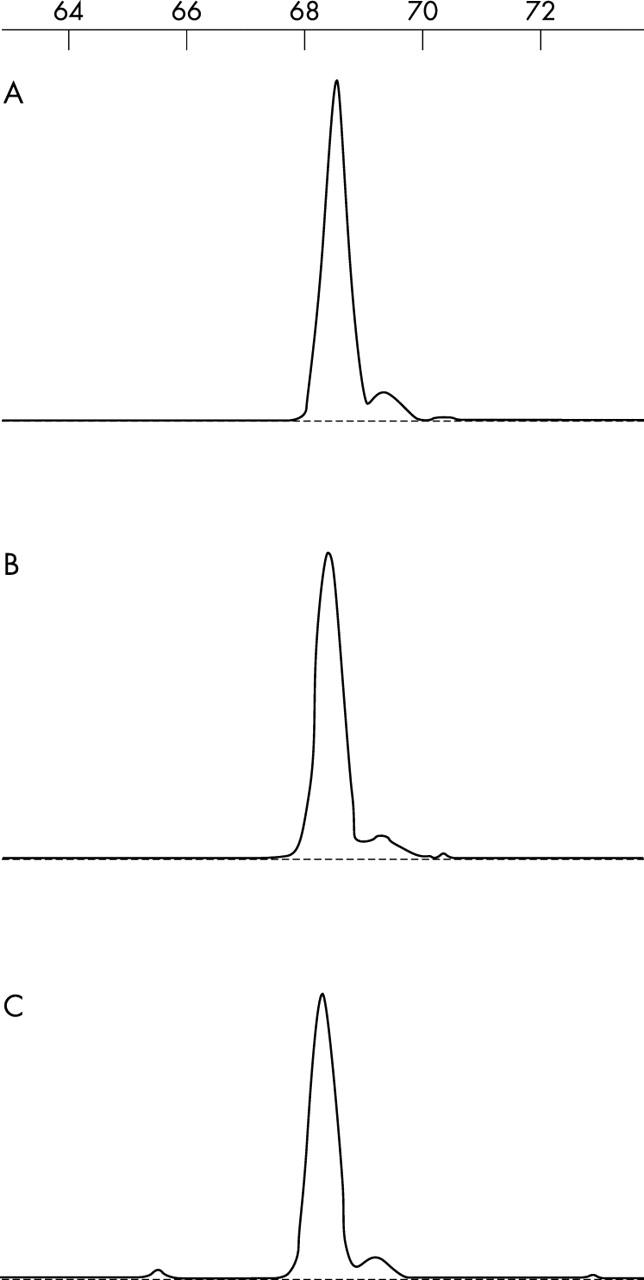
Figure 2.

T cell receptor gene rearrangement analysis by fluorescence polymerase chain reaction and capillary electrophoresis detection. Note the presence of the same monoclonal T cell population in the three samples analysed: (A) bladder biopsy; (B) original gastric biopsy; and (C) lymphocytic gastritis-like biopsy. See text for further comments.
