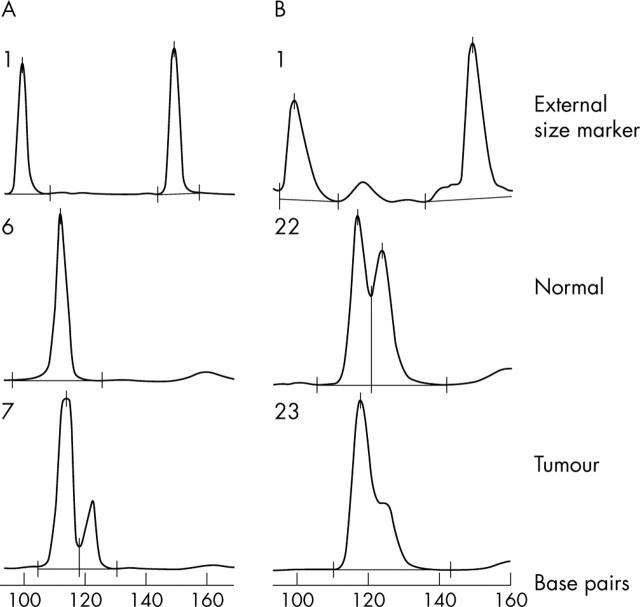
Figure 1.
Representative electropherogram showing microsatellite instability (MSI) and loss of heterozygosity (LOH). (A) MSI for marker D3S659. The normal DNA (lane 6) shows a single peak (homozygous, non-informative case), whereas tumour DNA (lane 7) contains a novel peak (122.6 bp). (B) Electropherogram showing LOH for Bat 25: the middle trace (lane 22) shows normal DNA and the lower trace (lane 23) shows tumour DNA with loss of the larger allele. Lane 1 represents the external marker that was run with all samples.

