Figure 1.
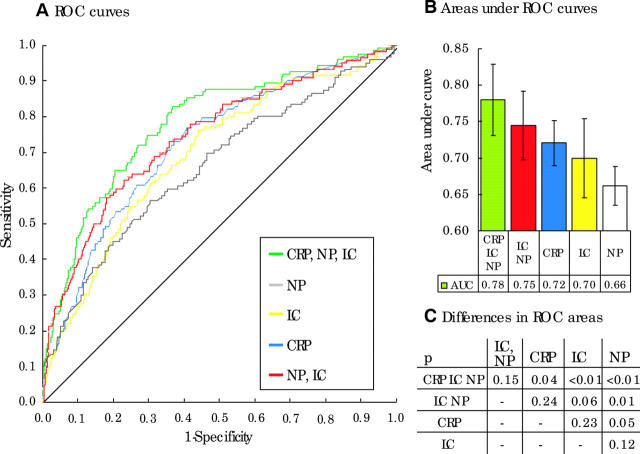
This figure illustrates the performance, in the validation of models built using C reactive protein (CRP) concentration, lymphocyte count (LC), and neutrophil count (NP). (A) Receiver operator characteristic (ROC) curves for models built using CRP concentration, lymphocyte count, and neutrophil count (CRP, LC, NP), lymphocyte and neutrophil counts (NP, LC), or single variables. (B) Areas under the ROC curves. (C) The significance of pairwise comparisons between the areas.

