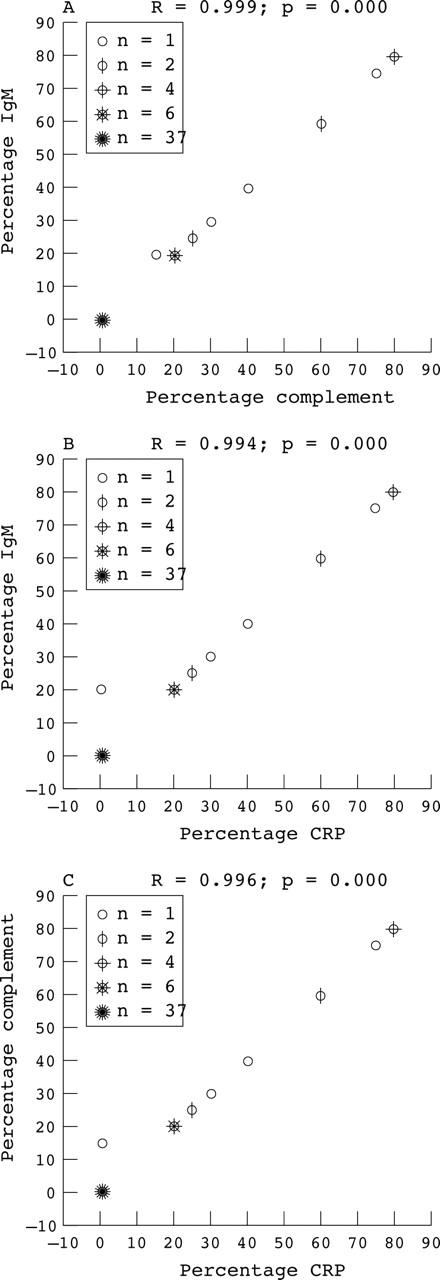
Figure 3.

Scatter plots of the extent of IgM/complement/C reactive protein (CRP) positive areas in individual patients. Scatter plots in which the extent of deposition (expressed as per cent of surface) of IgM, complement, and CRP for each patient are plotted against each other. (A) IgM versus complement; (B) IgM versus CRP; (C) CRP versus complement. For each plot, the corresponding correlation coefficient (R) and the two tailed significance (p value) are given.
