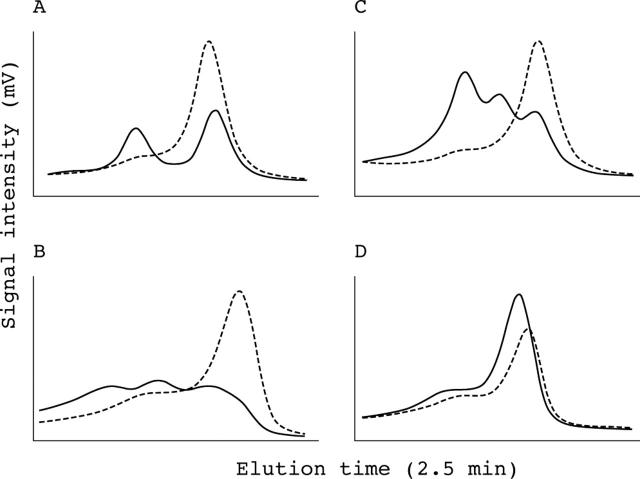
Figure 5.
Denaturing high performance liquid chromatography (DHPLC) profiles of DNA variants at two different temperatures without normalisation. A sample with a heterozygous change in PVR exon 2 (E116E, 16101 G>A) shows significant differences in DHPLC profile compared with the wild-type control (dashed line) at both 64.1°C (A) and 66.9°C (B). A second heterozygous change in PVR exon 2, (R133R, 16152 G>A) shows a significant difference at 64.1°C (C) only, and not at 66.9°C (D).

