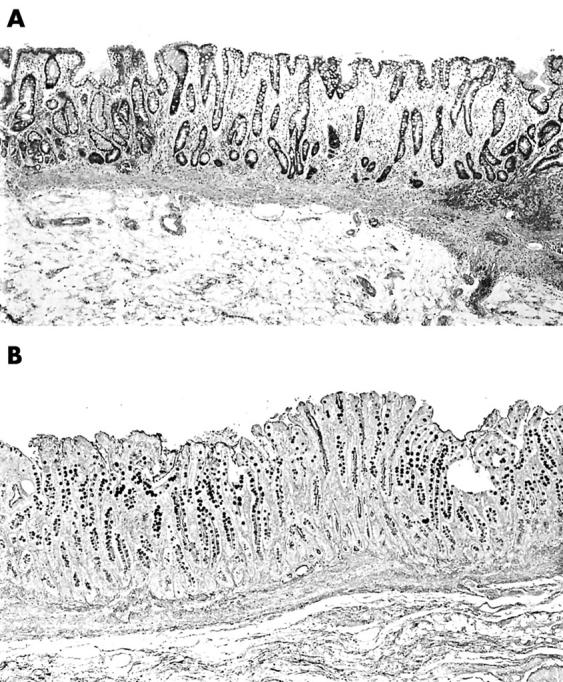
Figure 2.

(A) Section from a gastrectomy specimen showing intestinal metaplasia in the entire low power field (haematoxylin and eosin stain; original magnification, ×4). (B) Section from a gastrectomy specimen showing intestinal metaplasia in the entire low power field (Alcian blue stain, pH 2.5, without counterstain; original magnification, ×4)
