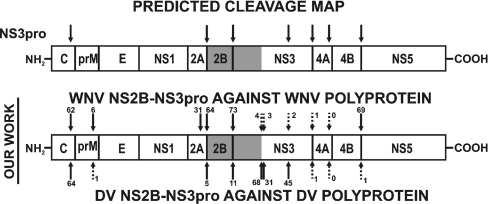
Figure 6. The cleavage map of the WNV and the DV polyprotein precursor.
The top model shows the NS3pro cleavage sites which were predicted previously by other authors [7,10,12,13,16–19,24,26,36,38]. The lower model shows the predictions based on the present results. The peptide sequences (Table 1) which span the potential cleavage sites were synthesized and then subjected to the WNV and DV proteases. The numbers indicate the percentage efficiency of the cleavage.

