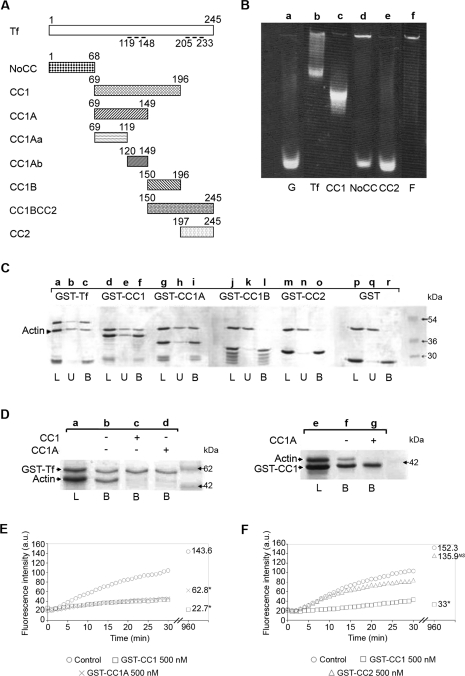
Figure 1. Toxofilin binds to G-actin via the CC1A domain.
(A) Schematic representation of full-length toxofilin and toxofilin domains used throughout the present study. Amino acids are numbered on top of the schemes. Dashed lines represent the two coil–coiled domains. Tf, toxofilin. (B) A 7.5% acrylamide native gel assay was performed using 50 μg of IAEDANS-labelled G-actin incubated without (lane a) or with equimolar amounts of recombinant GST–toxofilin (lane b), GST–CC1 (lane c), GST–NoCC (lane d) or GST–CC2 (lane e). F-actin was loaded as a control (lane f). (C) G-actin binding assays were performed on immobilized GST–toxofilin (GST–Tf; lanes a–c), GST–CC1 (lanes d–f), GST–CC1A (lanes g–i), GST–CC1B (lanes j–l), GST–CC2 (lanes m–o) and GST alone (lanes p–r). Following overnight incubation, the resin was washed and bound proteins were eluted in SDS sample buffer prior to SDS/PAGE and Coomassie Blue staining. L indicates the total load, U indicates the total unbound fraction and B indicates the total bound fraction. The arrowhead indicates the position of G-actin. (D) Actin-binding competition assays were carried out on immobilized GST–toxofilin (GST–Tf) using G-actin preincubated without (lane b) or with CC1 (lane c) or CC1A (lane d) and on immobilized GST–CC1 using G-actin preincubated or not with CC1A (lanes e–g). Samples were treated as described for (C). L indicates the total load and B indicates the total bound fraction. The presence of the competitive fragment is indicated above the gel photograph. (E) Pyrene actin polymerization kinetics in the presence or absence of 500 nM GST–CC1 (□) and GST–CC1A (×) polypeptides using pyrene actin. Numbers on the right of the curves represent the actin steady-state values obtained 16 h after the assay. *The difference with the control values (○) are statistically significant at P=0.05 (Student's t test). a.u., arbitrary units. (F) Pyrene actin polymerization kinetics in the presence or absence of 500 nM GST–CC1 (□) and GST–CC2 (△) polypeptides using pyrene actin. Numbers on the right of the curves represent the actin steady-state values obtained 16 h after the assay. *The differences with the control values (○) are statistically significant at P=0.05 (Student's t test). NS, not significant; a.u., arbitrary units.

