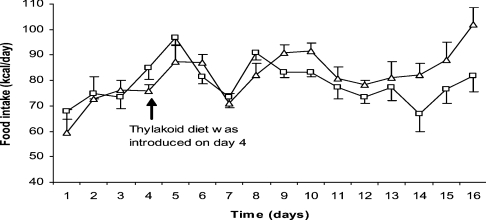
Figure 4. Effect of added thylakoids on Sprague–Dawley rats on a high-fat diet for 13 days.
Food intake with thylakoids (□) and without thylakoids (△). The daily food intake is given as means±S.E.M. from eight animals in each group (n=8). Treatment with thylakoids shows a significant suppression of food intake (two-way ANOVA; P=0.017).

