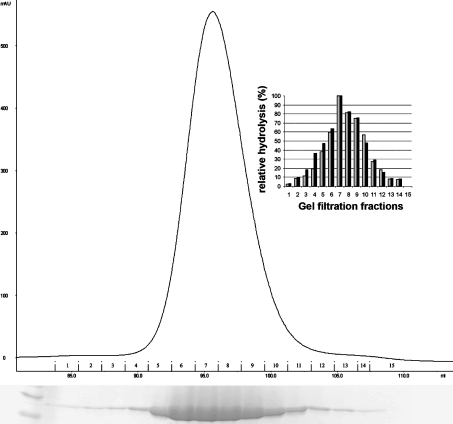
Figure 2. GTPase and NTPase activity of the gel-filtration fractions of the CENTG1 GLD.
Chromatogram of the Superdex 75 gel-filtration run with the Coomassie Blue-stained SDS/PAGE gel corresponding to the fractions displayed beneath. The extreme left of the gel shows the molecular-mass markers. The measured activity was plotted for every fraction. The black and grey bars in the inset histogram represent the percentage of GTPase and NTPase activity of each fraction respectively.

