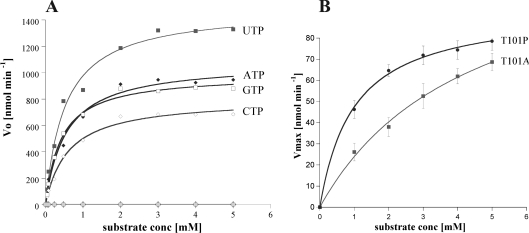
Figure 4. Hydrolysis activity of the wild-type and mutant CENTG1 NTPase domains.
(A) Plot of the initial rate of reaction Vo against concentration of nucleotide triphosphates (mM), fitted to the Michaelis–Menten equation using Kaleidograph software. Hydrolytic rates determined in the absence of enzyme or nucleotides are shown respectively as light grey diamonds and squares along the x-axis. Other lines are labelled. (B) GTP hydrolysis of CENTG1 mutants. Plot of Vmax against substrate concentration (mM) fitted as for wild-type.

