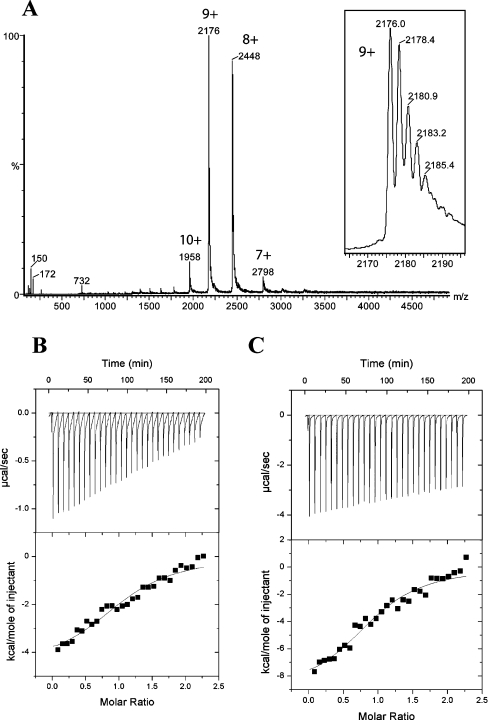
Figure 5. Nucleotide-binding analysis.
Nano-electrospray ionization MS analysis of the CENTG1 NTPase domain in the presence of a 10-fold excess of ribonucleotide triphosphates does not show any nucleotide bound to the protein. The highlighted peaks correspond to charge states of the protein (calculated mass 19581.1 Da, measured mass 19575±8 Da). The inset shows Na+ attachment to the 9+ peak. (B) ITC of interactions between CENTG1 and GTP[S]. The upper panel displays raw energy changes during titration (time), and in the lower panel the derived integrated total energy changes as a function of the molar ratio of the interactants. The yielded thermodynamic parameters are listed in Table 3. (C) ITC interactions between CENTG1 and ATP[S]. The representation is the same as for (B).

