
Figure 2.
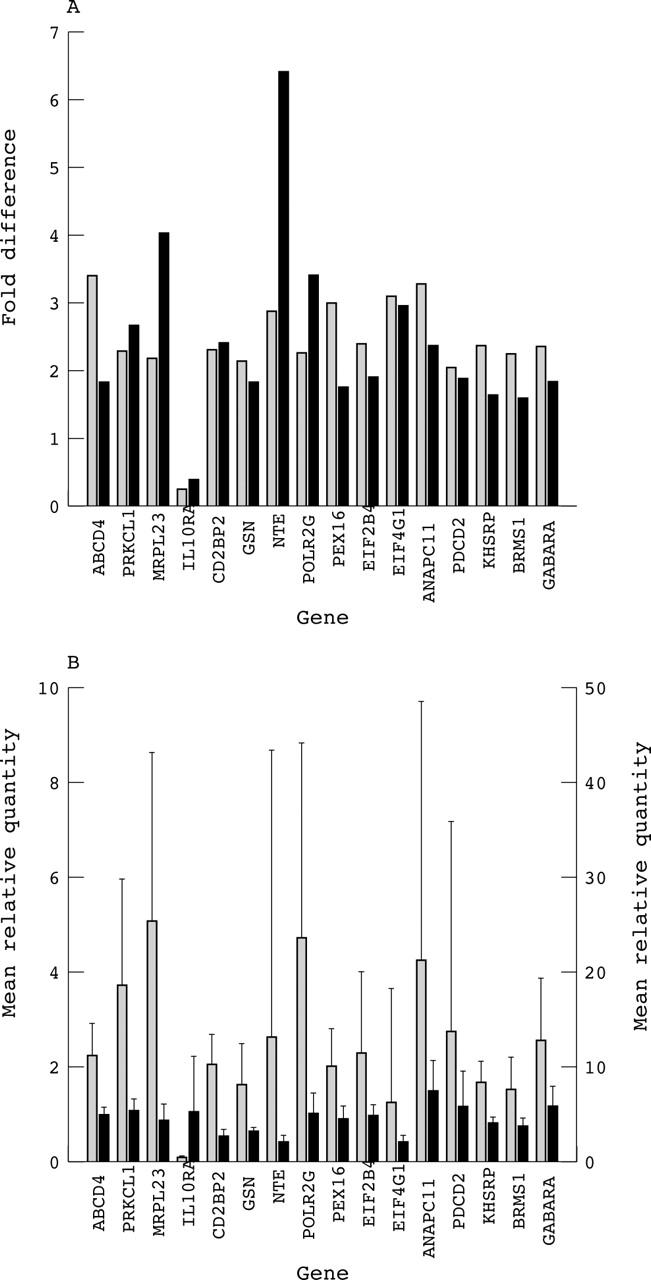
(A) Bar chart showing the fold difference in gene expression between test and control groups by microarray (shaded) and real time polymerase chain reaction (solid black) for 16 genes that are differentially expressed in chronic fatigue syndrome (CFS). (B) Bar chart showing the mean relative quantity of mRNA transcripts in test (shaded) and control (solid black) groups for 16 genes that are differentially expressed in CFS. Error bars indicate the standard deviation from the mean in each case. All values for the mean relative quantity mRNA transcript are shown on the left y axis, except those for NTE and EIF4G1, which are shown on the right y axis.