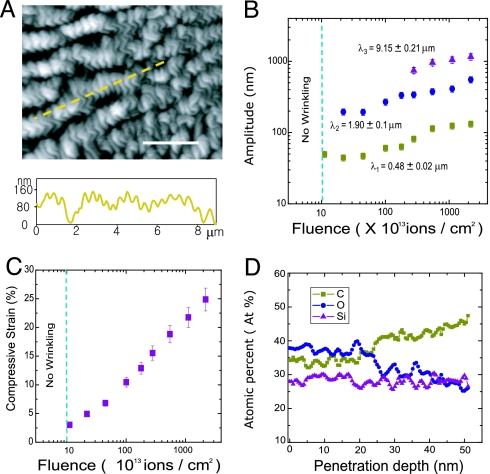
Fig. 3.
Examination of the surface topology and chemical composition of the PDMS exposed to FIB through depth. (A) (Upper) Morphology of PDMS surface exposed to FIB with fluence of 5.0 × 10¹³ ions per cm2 obtained by using AFM. (Scale bar: 3 μm.) (Lower) The normal deflection of the surface along the path identified in Upper by the dashed line. (B) Amplitude of the hierarchical wrinkles formed upon exposure of the PDMS surface to FIB with various fleunces. The primary wrinkles appear at the fluence of ≈1013 ions per cm2. The characteristic wavelengths associated with the surface morphology are calculated by FFT of the surface undulations obtained by AFM. (C) Average compressive strain in the stiff skin formed by exposure of the PDMS surface area as a function of ion fluence. The compressive strain is calculated by averaging the strain along at least five directions for each morphology studied (see Materials and Methods). (D) AES analysis of the PDMS surface exposed to FIB with ion fluence of 1.1 × 10¹³ ions per cm2. Because of exposure to the FIB, the concentration of C and O were changed at the first 25 nm of the PDMS from that of the original PDMS, whereas the Si component remains almost constant through the depth. Atomic concentrations of Si, O, and C become close to the pure PDMS after depth of 25 nm from the surface with average ratio of O/Si atomic concentration ≈0.97.

