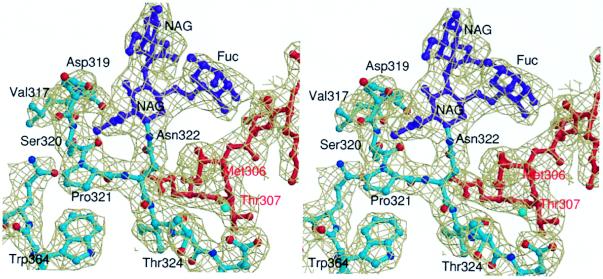
Figure 2.
Stereo view of the 2Fo − Fc electron density around the N-linked carbohydrate attachment site. All atoms are colored according to their type except for the carbohydrate moieties (purple) and the 304–308 {162–166} region of a neighboring molecule in the crystal (red). The map is contoured at 1σ and overlaid on the final refined model.

