
Figure 3.
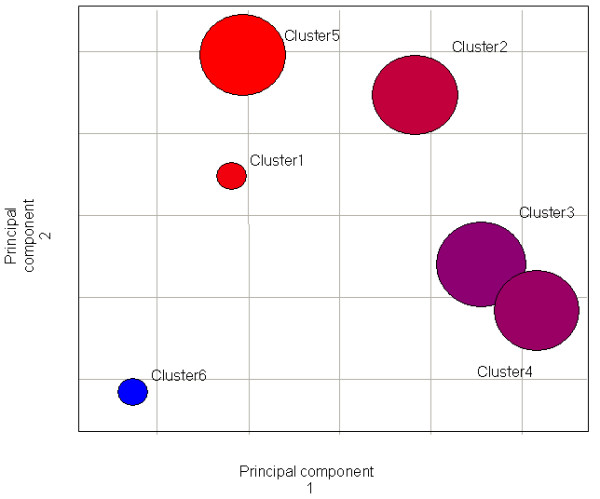
Results of clustering of 24 samples of skeletal muscle from patients with various degrees of obesity (Hulver at al.). The data breaks into 4 clusters and 2 singletons. Color indicates the prevalence of average BMI for the cluster (Cluster#-BMI): 1–25, 2–31.6, 3–40.9, 4–38.4, 5–22.0, 6–62.0.