
Figure 1.
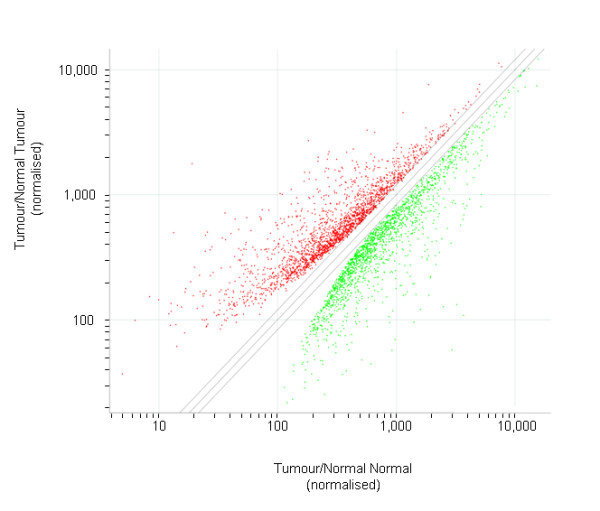
Scatter Plot of the 3,921 gene transcripts identified as significantly differentially expressed (by ≥1.2 fold; ≥100 difference in expression intensity; P < 0.05) between BCC and normal skin specimens. Transcripts significantly up-regulated are shown in red; those down-regulated are shown as green.