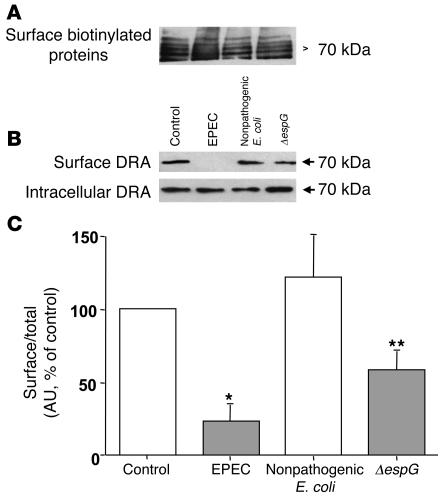
Figure 4. Cell-surface expression of DRA.
Caco-2 monolayers grown on plastic supports were infected with nonpathogenic E. coli, EPEC, or espG mutant for 60 minutes and subjected to biotinylation at 4°C using sulfo-NHS-biotin. After solubilization, biotinylated proteins were extracted with streptavidin-agarose from equal amounts of total cellular protein. Surface and intracellular fractions were run on 10% SDS–polyacrylamide electrophoresis gels, followed by transfer to nitrocellulose membrane. The blot was immunostained with an avidin-peroxidase antibody (A) or rabbit anti-DRA (B). Representative blot of 5 different experiments are shown. (C) Scanning densitometry of the DRA protein band was performed and the results expressed as surface/total DRA (surface plus intracellular DRA). The intensities of EPEC, nonpathogenic E. coli, and espG mutant were calculated in relation to those of the uninfected cells, and the value of each time control was arbitrarily set to 100. Values represent mean ± SEM of 5 different blots. *P < 0.01 versus control; **P < 0.05 compared with EPEC.

