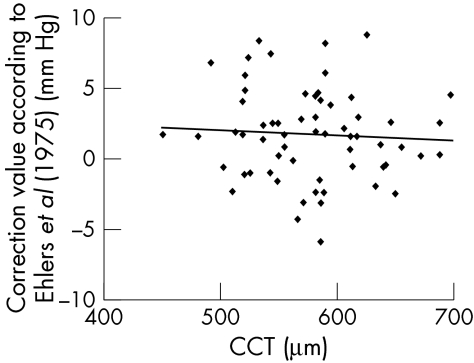
Figure 1 .
Dependence of differences in IOP measurements from CCT. Data of figure 2 of Feltgen et al obtained by digitisation; 68 of the 73 data points could be identified. The four outliers shown by Feltgen et al as open circles are omitted. These outliers would have made the use of the same scale in both diagrams more difficult. Thus n = 64. Same scale as in Figure 2.

