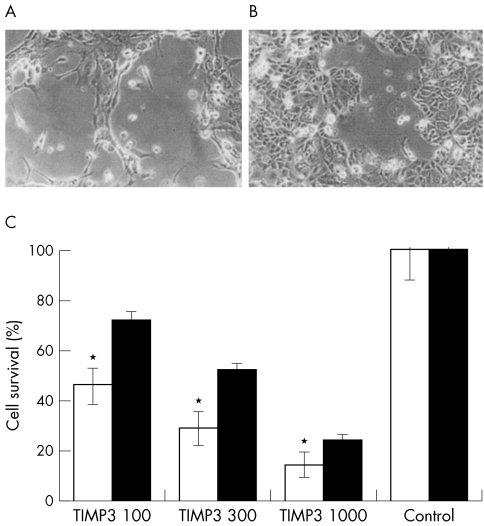
Figure 5.
(A, B) Representative photographs (×100) showing RPE (A) and MCF7 (B) cells 48 hours after infection with RAdTIMP-3. Note the cells rounding up and lifting, leaving patches of cell loss, consistent with localised TIMP-3 deposition. (C) A histogram of the numbers of viable RPE (open bars) and MCF7 (solid bars) cells remaining in culture 48 hours after infection with RAdTIMP-3. These cells were trypsinised, stained with trypan blue, and counted with a haemacytometer. Statistical significance, by Student's t test, compared with corresponding MCF7 group: *p <0.001 (n=9). Statistical significance, by Student's t test, compared with corresponding control group p<0.001 (n=9) for all groups.

