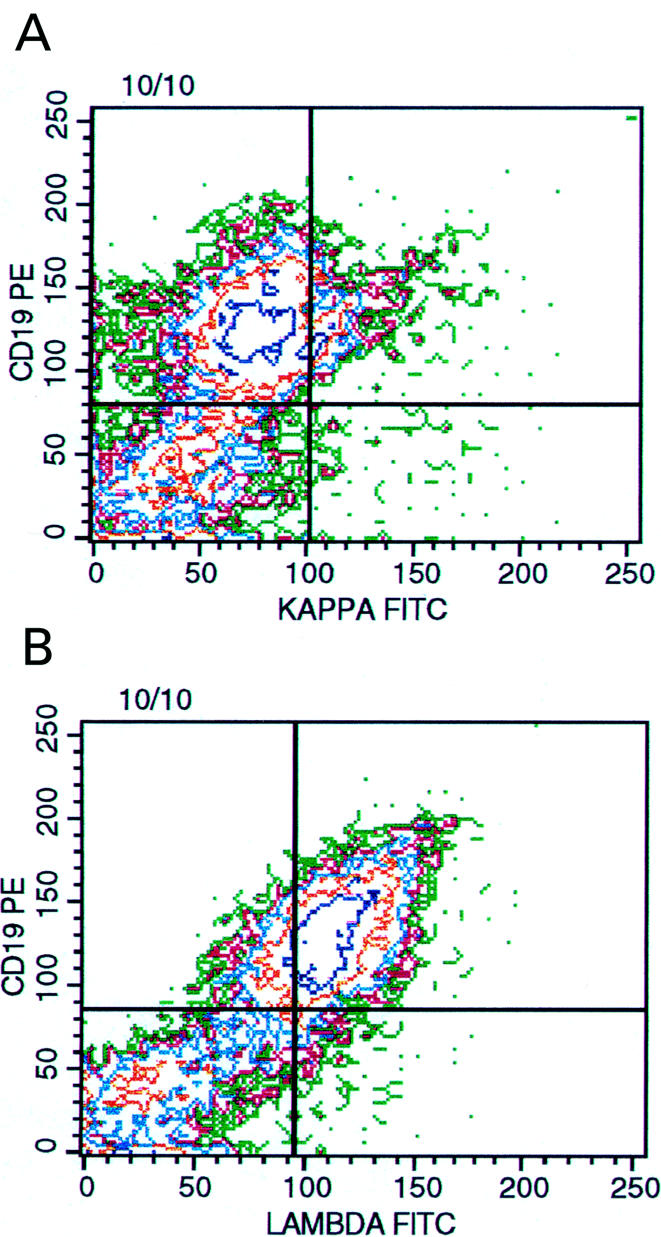
Figure 2.

Multivariable, three colour flow cytometric histogram of vitreous lymphocytes showing a cluster of cells (upper right quadrant, 20% of the lymphocyte gate) coexpressing CD 19 and kappa light chain (A). However 58% of the B lymphocytes express surface lambda light chains (B). The pattern of dot plots indicates the presence of a monoclonal, lambda light chain restricted B cell population.
