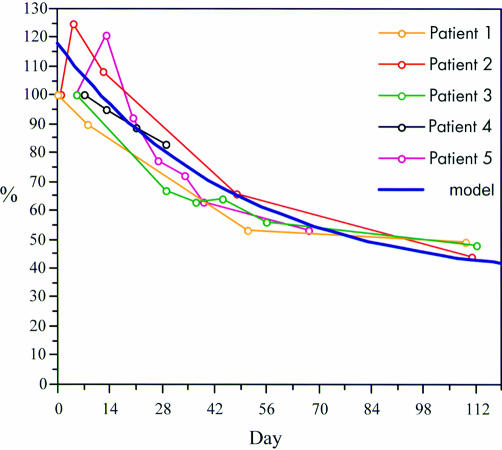
Figure 3.
Individual relative measurements of retardation values obtained by scanning laser polarimetry in the injured eye at each visit (indicated by circles) in all five patients, shown in different colours. The initial value was set as 100% and all subsequent values as percentages thereof. A calculated model is drawn as a solid dark blue curve.

